LinkedIn Content Strategy: A 3-Month Plan Built on Decisions, Not on Posting Formulas
A LinkedIn content strategy for three months: one goal, one reader, three or four themes, a rhythm you can keep. With what LinkedIn and the studies say.

A LinkedIn content strategy is a short list of decisions that fits on one page. It names one goal, one reader, three or four fixed themes, a rhythm you can keep, a format to repeat and a review date. It is not a posting formula.
The formulas are easy to find: post this many times a week, in this mix, in this format. When I put the studies behind those formulas side by side, they disagreed on how often to post and on the numbers behind each format. LinkedIn’s own page for creators, as of November 2026, gives one range as advice and no formula: 2-5 posts per week.
I work as a Marketing Engineer: Digital since 12, full Marketing since 20. This guide sets LinkedIn’s official pages next to the third-party studies, and adds the three-month plan I wrote for my own profile.
Key Takeaways
- A strategy is a list of decisions. One goal, one reader, three or four themes, a rhythm, a format and a review date fit on one page.
- LinkedIn gives a range as advice, not a rule. Its page for creators says 2-5 posts per week, and the help pages I read on November 18, 2026 name no number.
- The frequency studies disagree. A Buffer article reports more impressions per post as weekly posts rise, while the regression page on the same data reports lower reach per post.
- Documents lead in three studies, the numbers differ. Two put them ahead of text and one ahead of images and video, with top figures of 21.77%, 6.40% and 2,639 views.
- Your own baseline beats any benchmark. Creator analytics are open to all members, and combined post analytics cover the past 7 to 365 days.
What Is a LinkedIn Content Strategy?
A LinkedIn content strategy is the set of decisions you make before you write a single post. It says why you publish, for whom, about what, how often, in which format and when you check the results.
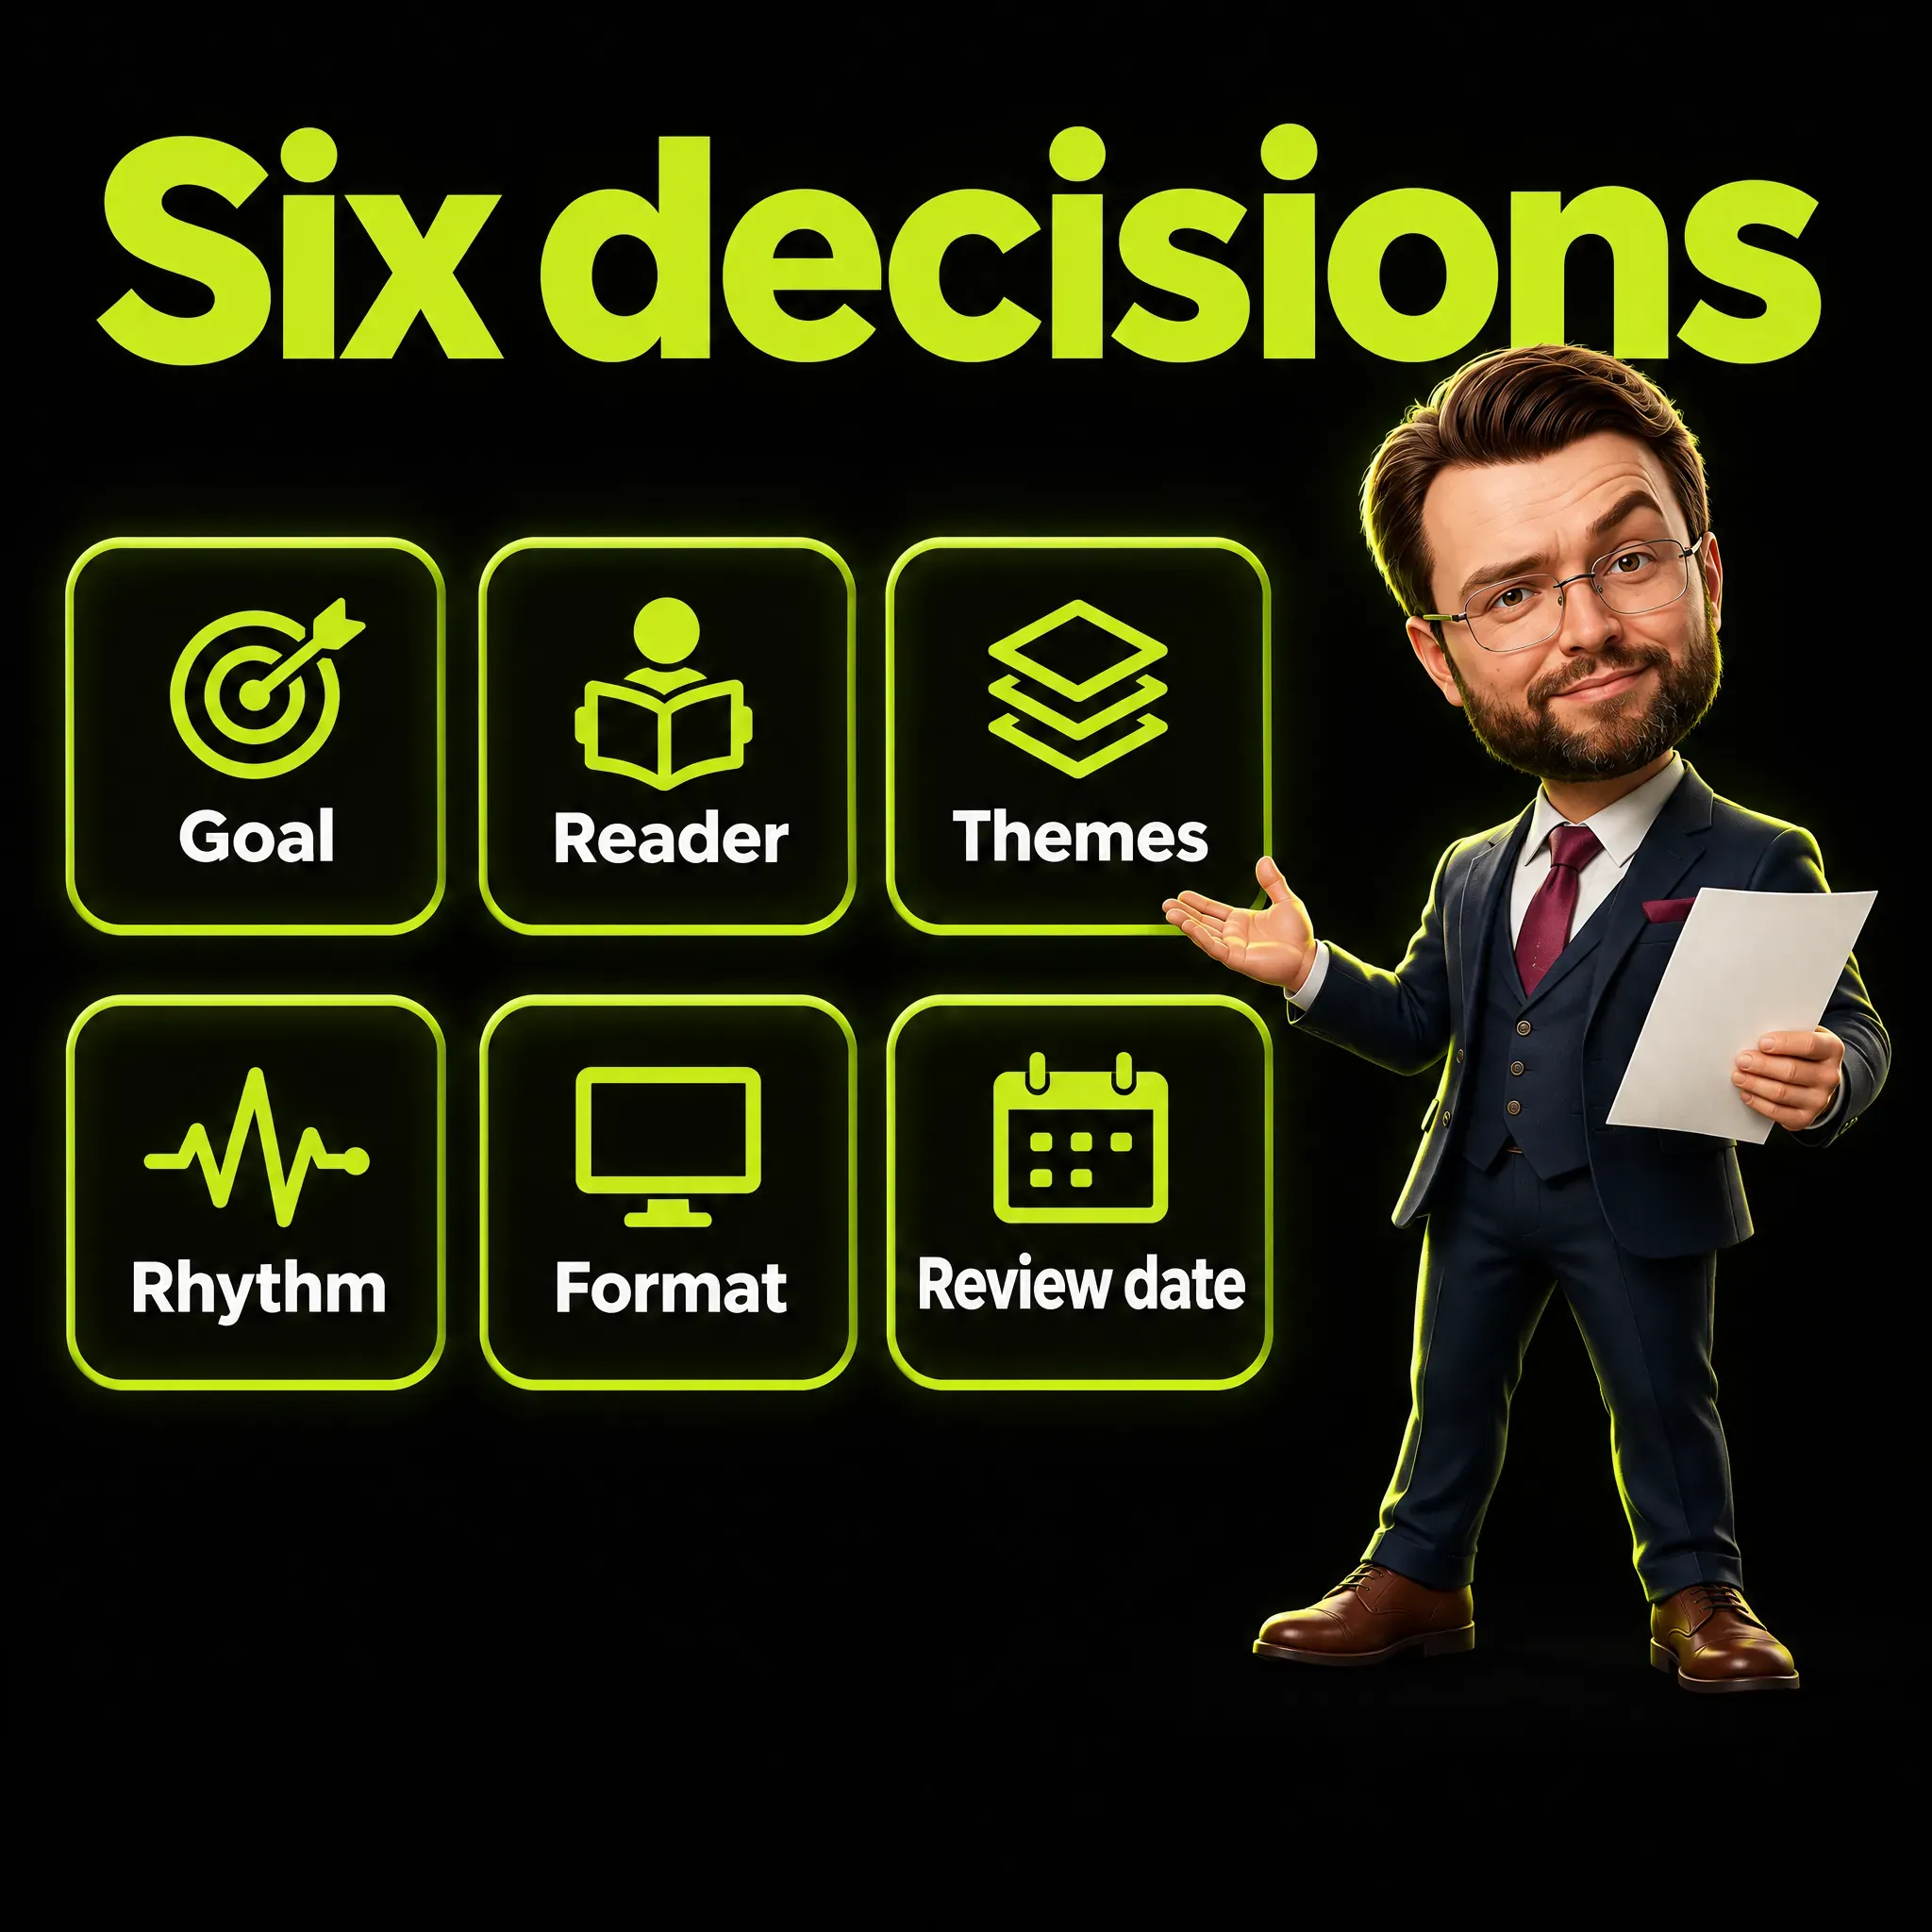
This is the list I would write down, one line each.
- Goal. What you want to be true in three months, in plain words.
- Reader. One person you can describe in a sentence.
- Themes. Three or four subjects you come back to every week.
- Rhythm. How many posts you can write well, week after week.
- Format. One or two formats you repeat until you are good at them.
- Review date. The day you sit down, read the numbers and decide what to change.
Without that page you still publish, but each post is a separate bet. With it, every post is one test of the same plan.
What Is the Goal? Decide What Counts Before You Count
The goal is one sentence about what should change for you, not a number on a dashboard. I suggest you write it in plain words first and choose the measures second. If you start from the measure, you end up chasing whatever number moves the fastest.
The goal at the top of my own plan is a sentence, not a number: to be known for my trade by the people who need it. So I would call a post a success when it starts conversations with the right people. A high impression count alone would not be enough.
An impression counts each time a post appears on a screen, read or not. The count does not say who was on the other side.
Your goal may be clients, a new job or thought leadership, which means offering a new idea, backed by evidence, that changes how buyers think about a problem. All of them sit inside your LinkedIn personal branding, the picture people keep of you. The content strategy is the part of it that you publish.
Who Is the Reader, and How Many Themes Do You Need?
Pick one reader you can describe in a sentence. Then pick three or four themes that this reader cares about and that you have real material for. A theme, often called a content pillar, is a subject you return to week after week.
Here are example themes from my own planning, to show how specific a theme should be. I would start with three or four, because fewer themes give each one enough posts to compare.
- AI at work, kept under control.
- Tracking and data without illusions.
- Building in public, which means showing the work while it is in progress.
- Being found in search engines and in AI answers.
- How work with clients goes day to day.
- A contrarian opinion, always with proof.
Each theme starts with a share of the posts, and every share is a hypothesis. I would change the shares only once every theme has enough posts to compare.
For what to write inside each theme, I keep a separate guide to LinkedIn post ideas.
How Often Should You Post on LinkedIn? Two Readings of One Data Set
The data gives no single answer: two readings of the same Buffer data set point in opposite directions on reach per post. Both agree that engagement rate rises with more posts. Both also name two to five posts a week as a fair place to start.
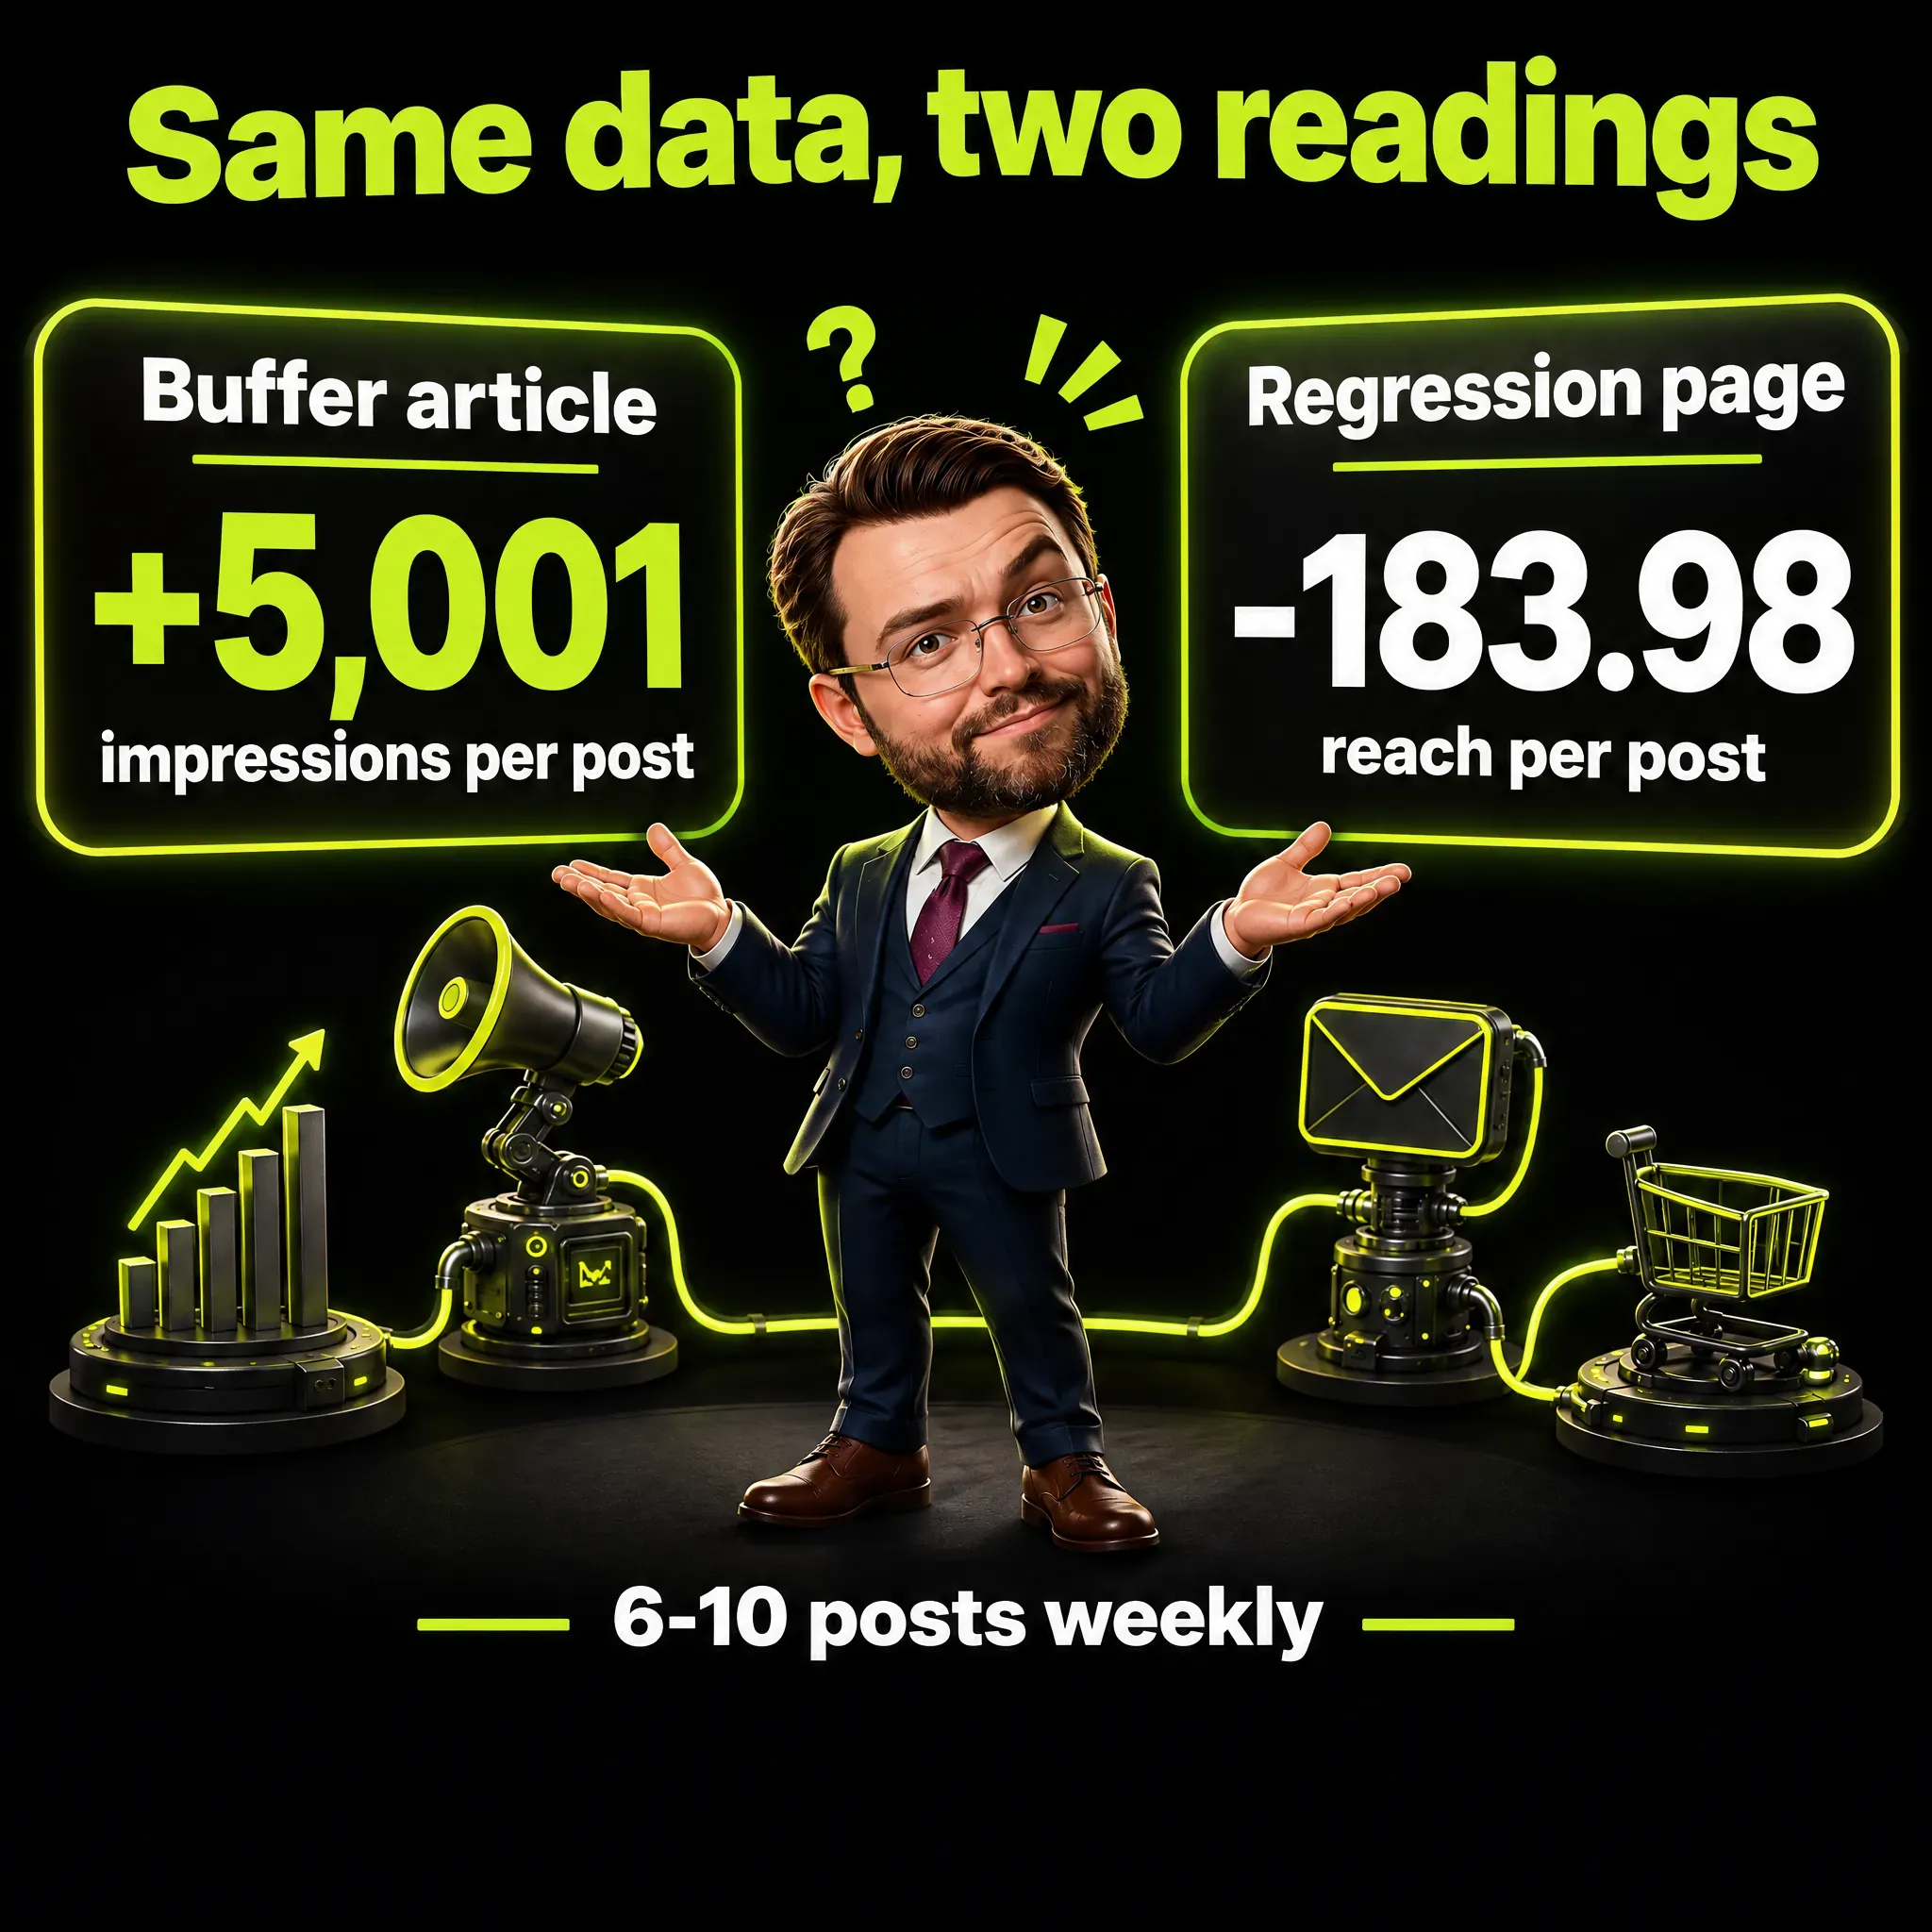
The first reading is the Buffer article on posting frequency, dated August 28, 2025. It covers more than 2 million posts and compares busier and quieter weeks of the same accounts, each range of weekly posts against one post a week. Its advice: “Start in the 2 to 5 posts a week range and focus on making that cadence a habit”.
The second reading is the regression page by Julian Winternheimer, Buffer’s data scientist, dated August 1, 2025 and published on his own site. It lists 2,020,612 observations, each one a week of one profile, from 94,485 profiles connected to Buffer. It counts only posts with more than 5 engagements, from profiles that posted in at least 4 weeks of the year.
Its summary reads: “Higher posting frequencies result in higher engagement rates, but lower reach per post”.
Both pages say they use a fixed effects regression, a statistical method that compares each account with itself to isolate one effect: the number of weekly posts. Here are the two sets of numbers, both measured against weeks with one post.
| Posts per week | Buffer article: impressions per post | Regression page: reach per post |
|---|---|---|
| 2 to 5 | +1,182 | -41.6 |
| 6 to 10 | +5,001 | -183.98 |
| 11 or more | +16,946 | -650.2 |
On engagement rate the two pages agree. Engagement rate is the number of reactions, comments and shares a post gets, divided by the times it was shown. It rises by 0.23 percentage points at 2 to 5 posts, by 0.76 at 6 to 10 and by 1.40 at 11 or more.
Neither page explains why the reach numbers have opposite signs, and I will not guess. The article calls its figure a lift in reach and counts it in impressions per post, which it defines as how many people saw each post. The regression page reports reach per post.
One detail helps to weigh the two: the regression page shows its code and its output. Before it compares each account with itself, its averages rise too, from 694 reach per post in one-post weeks to 2,616 at 11 or more. The page warns that larger accounts with more engagement probably tend to post more often.
The regression page also calls its smallest drop, the one at 2 to 5 posts, statistically marginal: small enough that chance could explain it.
A third source looks at the gap between two posts. Ordinal’s article on posting frequency says that posts published within 12 hours of each other see 17% lower engagement in its own data. Ordinal sells a scheduling tool and does not describe the sample, so I treat the figure as an indication.
The regression page states its own limit: “The algorithm may optimize for higher engagement rates, but there’s no way for us to know for sure”. I cover the LinkedIn algorithm, the software that picks the posts in each feed, in its own guide.
Which Rhythm Should You Pick? The One Your Quality Can Hold
Pick the number of posts you can write well every week for three months. The studies can suggest a range, but they cannot make that choice for you. In my plan the limit was never the calendar: it was the number of drafts good enough to publish.

That showed up as soon as I judged the first drafts: fewer passed than the calendar had room for. So I would plan from the drafts that pass your own check, not from empty slots.
Winternheimer, in the Buffer article: “Post as often as you can - as long as the quality stays high”. Ordinal: “Pick the number you can hold for 90 consecutive days”.
So I suggest this order. First count how many good posts you can produce in a normal week, then set the rhythm one step below that.
Which Formats Work on LinkedIn? Documents Lead in Three Studies, the Numbers Differ
Two studies put documents and carousels ahead of plain text, and a third puts them ahead of images and video. They disagree on every number, because each one uses a different sample and a different formula. I would read the order as a hint and leave the percentages aside.
A document post is a PDF that readers swipe page by page, which is why people call it a carousel. Here is what each study measured.
| Study | Sample | Measure | Top format |
|---|---|---|---|
| Buffer, March 2026 | 45M+ posts across several platforms | Median engagement rate, formula not stated for LinkedIn | Carousels, 21.77% |
| Socialinsider, Q3 2026 | 2.45 million posts from 26,000 company Pages | Average engagement rate by impressions | Documents and multi-image posts, 6.40% |
| Magnettu, 2026 | 16,790 posts from 689 brands, January to July | Average views | Documents, 2,639 views |
The sources are the Buffer study of content formats, the Socialinsider LinkedIn benchmarks and the Magnettu report on brand posts. Socialinsider writes that documents and multi-image posts led, “both averaging a 6.40% engagement rate by impressions”.
The percentages cannot be compared, because the formulas differ. Buffer reports a median, the middle value when all posts are lined up, and its article does not say which interactions it counts on LinkedIn. Socialinsider reports an average over impressions and looks only at company Pages.
Magnettu counts views, not engagement, on posts from brands. So a claim such as carousels earning several times more than text is one study’s formula, not a fact about your profile. For how to build one, see my guide to the LinkedIn carousel.
The Shield Index looked at 50,000 posts from March 2026 and found images ahead of text at every level of performance. In the same index carousels sit behind text for a typical post: a reach rate of 11% against 12%, measured as impressions divided by follower count.
Its reading of text posts: “People who see a text post engage at the same rate. But fewer people are seeing it”. That is one month of data, and I would not drop a format because of it.
I would pick one or two formats you can produce well and repeat them long enough to compare.
How Long Should a Post Be, and Where Does the Link Go?
One study points to posts between 800 and 1,500 characters and to keeping the link out of the post text. Both findings are correlations on brand posts, so I use them as a starting point and not as a rule.
The study is Magnettu’s 2026 report on 16,790 posts from 689 brands. On length it says: “The top 10% of posts by views have a median of 1,124 characters, clearly above the overall median of 975”.
On links, the median number of views drops by 57%, from 369 to 157, when the link sits in the text. The report itself adds: “A nuance: this is a correlation, not proven causality”. The sources disagree on where a link works best, and I compare them in my guide to the LinkedIn algorithm.
My own length rule did not come from that study. It came from judging drafts that were too short to say anything useful.
In my plan the link in the first comment has the status of a candidate: a common practice that still needs proof.
Does LinkedIn Give an Official Number of Posts per Week?
It gives a range as advice, not a rule, and you find it outside the help pages. The help pages I read on November 18, 2026 name no number of posts per week. The help page on best practices for sharing content, last updated two years ago, only points elsewhere.
It reads: “Check out LinkedIn’s official resource for guidance on creating content that is valuable and impactful”. The link leads to LinkedIn’s Create pages. There the page on the key elements of a well-crafted post names a range: “Aim to publish between 2-5 posts per week”.
So where does the label LinkedIn Marketing Solutions, 2026 come from? Some third-party articles attach it to frequency figures, and the link behind it leads to a LinkedIn page that collects member posts on posting frequency. The box on that page says: “Summarized by AI based on LinkedIn member posts”.
That is a summary of what members wrote, not a statement from LinkedIn.
Here are the rules I see repeated most often, next to what I found when I looked for the source.
| Widespread rule | What the source says |
|---|---|
| Post 3 to 5 times a week | No official page names 3 to 5. LinkedIn’s page for creators and the two Buffer pages name 2 to 5 |
| Use a 70/15/15 content mix | No official source in the LinkedIn pages I read |
| LinkedIn sets a posting frequency | Advice only: its page for creators says 2-5 posts per week, and the help pages I read give no number |
| More posts bring more reach per post | The Buffer article says yes, the regression page on the same data says no |
| Two posts within 12 hours lose 17% | One vendor’s own data, sample not described |
| Carousels earn 585% more than text | One study, median engagement rate, formula not stated for LinkedIn |
| Text no longer works | One month of data from one index, and the same engagement rate for those who see it |
The habit I suggest is small. Next to every rule you adopt, write who measured it, on which sample and with which formula.
A LinkedIn Content Plan for 13 Weeks
My plan covers 13 weeks, about three months, in four phases. I show it because the structure is the part you can reuse: calibrate, find a rhythm, test one thing at a time, review.
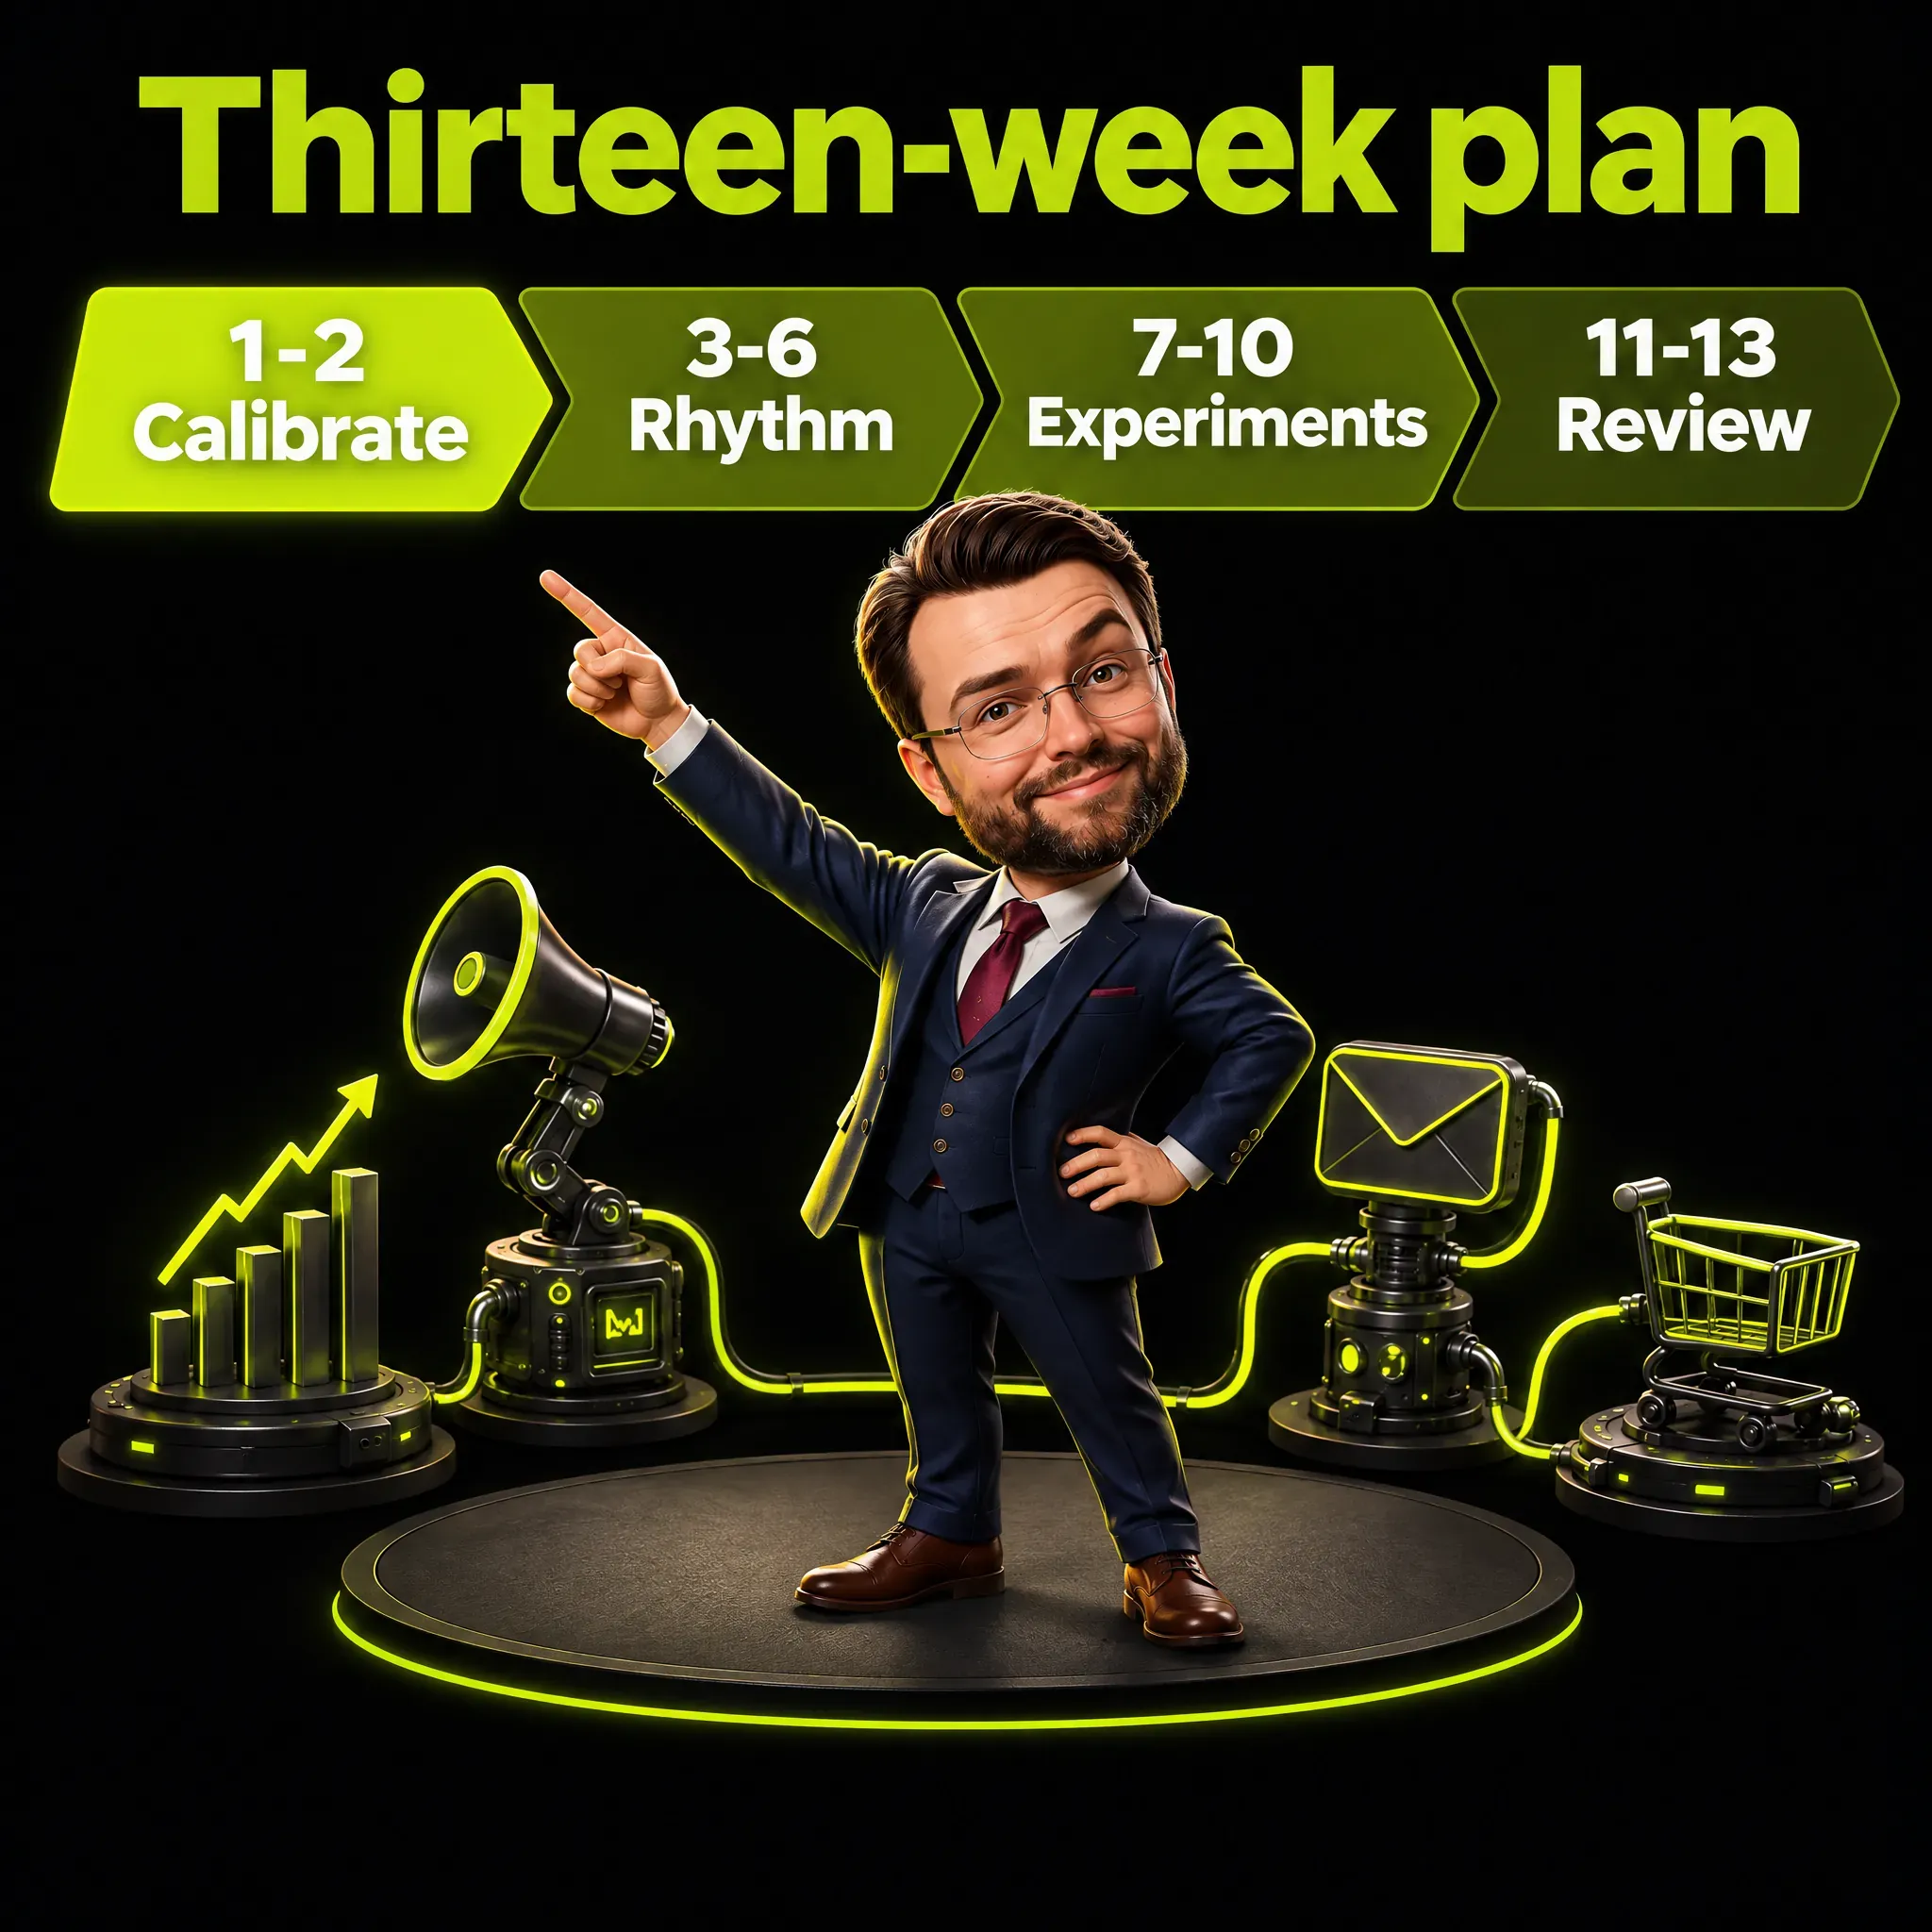
These are the four phases as they stand in the plan.
| Weeks | Phase | What it is for |
|---|---|---|
| 1 to 2 | Calibrate | Settle what a good post looks like by judging drafts |
| 3 to 6 | Rhythm and personal norm | Hold the pace and learn what is normal for your own posts |
| 7 to 10 | Experiments | Change one variable at a time, on two small groups of posts |
| 11 to 13 | Review | Read the themes against the goal, then keep, change or drop |
A personal norm is your own baseline: the numbers a normal post of yours gets before any experiment. Inside each week the cycle is the same: drafts are written and judged before anything goes on the calendar. I would read each post’s numbers after one day and again after one week, and review the plan at the end of each phase.
In the experiment weeks the plan changes one thing, such as the length or where the link goes, and keeps the rest the same. Two small groups of posts are a thin sample, so I would read the result as a direction and not as proof.
If four phases feel heavy, a lighter LinkedIn content plan gives one month to each step. Month one sets the page and a pace of two to five posts a week, month two runs one experiment, month three reviews the themes.
How to Build a LinkedIn Content Calendar With Scheduling
As of November 2026, LinkedIn has a built-in scheduler, so a content calendar needs no extra tool. The help page on scheduling posts sets the window: “You can schedule a post between 10 minutes and 3 months from the current time”.
On desktop the steps are these.
- Click Start a post and write the post.
- Click the Clock icon in the lower-right corner of the post window.
- Choose the date and the time, then click Next.
- Click Schedule.
The page also notes: “Scheduled times are converted to UTC based on your device’s time zone settings”. UTC is the world reference time, so I would check the hour when scheduling from another device or another country.
From the same Clock icon, View all scheduled posts opens the Scheduled posts page, where you can edit, reschedule or delete a post. Events and jobs cannot be scheduled.
I would fill the calendar one week at a time, right after the drafts are judged. A queue of three months looks tidy, but it locks in posts written before you learned anything. For the hour itself, see my guide to the best time to post on LinkedIn.
How Do You Write the Strategy Down? Small Rules With a Status
I write the strategy as a list of small rules, one line each. Next to each rule I note where it came from and whether it is firm or still on trial. If the data later contradict a rule, I withdraw it.
These are the rules that came out of judging my first drafts.
- A text is long enough to tell what happened, show one number and explain it.
- One message and one thing to learn per post, said at the start.
- A number appears only if the reader can follow its logic.
- One technical term per post, explained.
- An image is vertical and carries one idea and few large words.
- List and step topics become a carousel, with a strong call to action on the last page.
- Links and sources go in the first comment, a rule still on trial.
- Drafts can start with AI help, as long as the idea, the edits and the control stay mine.
- No automation of engagement: no automatic comments, mass tags or exchanges.
A call to action is the line that tells the reader what to do next. Here is an invented example of the rule on numbers. 0 sales out of 80 clicks looks like a disaster until you know that 80 clicks was one day of traffic.
How Do You Measure Whether the Strategy Works?
Measure against your own earlier posts, in LinkedIn’s own analytics, and count by hand the one thing that matches your goal. The help page on creator analytics states: “All LinkedIn members have access to creator analytics”. You do not need a paid tool for a 90-day review.

To open them, click the Me icon, then your profile card, and find the Analytics section. Show all opens two views.
- Content analytics. Impressions or engagements for a date range, plus your top performing posts.
- Audience analytics. New followers and the top demographics, such as job title, location and industry.
The page on combined post analytics lets you pick a range from the past 7 days to the past 365 days.
If your goal is to reach new people, watch the share of impressions from outside your network. LinkedIn describes it this way: “Percentage of impressions from members who don’t follow or aren’t connected to you”. For what the other counts mean, see my guide to LinkedIn impressions.
For posts other than videos, articles and newsletters, the post analytics page keeps engagement counts for 1,000 days. It adds: “Members reached data is available for 400 days”. The breakdown of who saw a post has a shorter life: “Demographic breakdowns are available for 180 days”.
So a review after 90 days loses nothing. A look back over a full year is different: the breakdown of who saw a post is gone after 180 days, so note it down before then.
The help pages on creator analytics and on combined post analytics describe an Export button that saves an .XLSX file, while the post analytics page mentions no export. What the dashboard cannot count is conversations with the right people. I would keep that tally by hand, next to the numbers.
Personal Profile or Company Page: What Changes?
Two things change: the scheduling limits and the studies you can rely on. On a company Page, the super admin and content admin roles schedule the posts, and fewer formats can be scheduled. Two of the three format studies in my table, on the other hand, describe Pages or brands and not people.
The help page on scheduling a Page post says: “You can schedule a post anywhere between an hour from the current time to three months in advance”. A Page cannot schedule events, multiple photos, reshares, polls, jobs or service posts.
Because those two studies measure company Pages or brands, I would not read them as a forecast for a personal profile. If you run both, I suggest two short strategies and not one long one.
A Real Question: Is It the Hook That Matters Most?
While I researched this guide, one question stood out in the search results. It comes from the result snippet of a thread in a Reddit community about LinkedIn strategy. A snippet is the short preview that a search engine shows under a link.
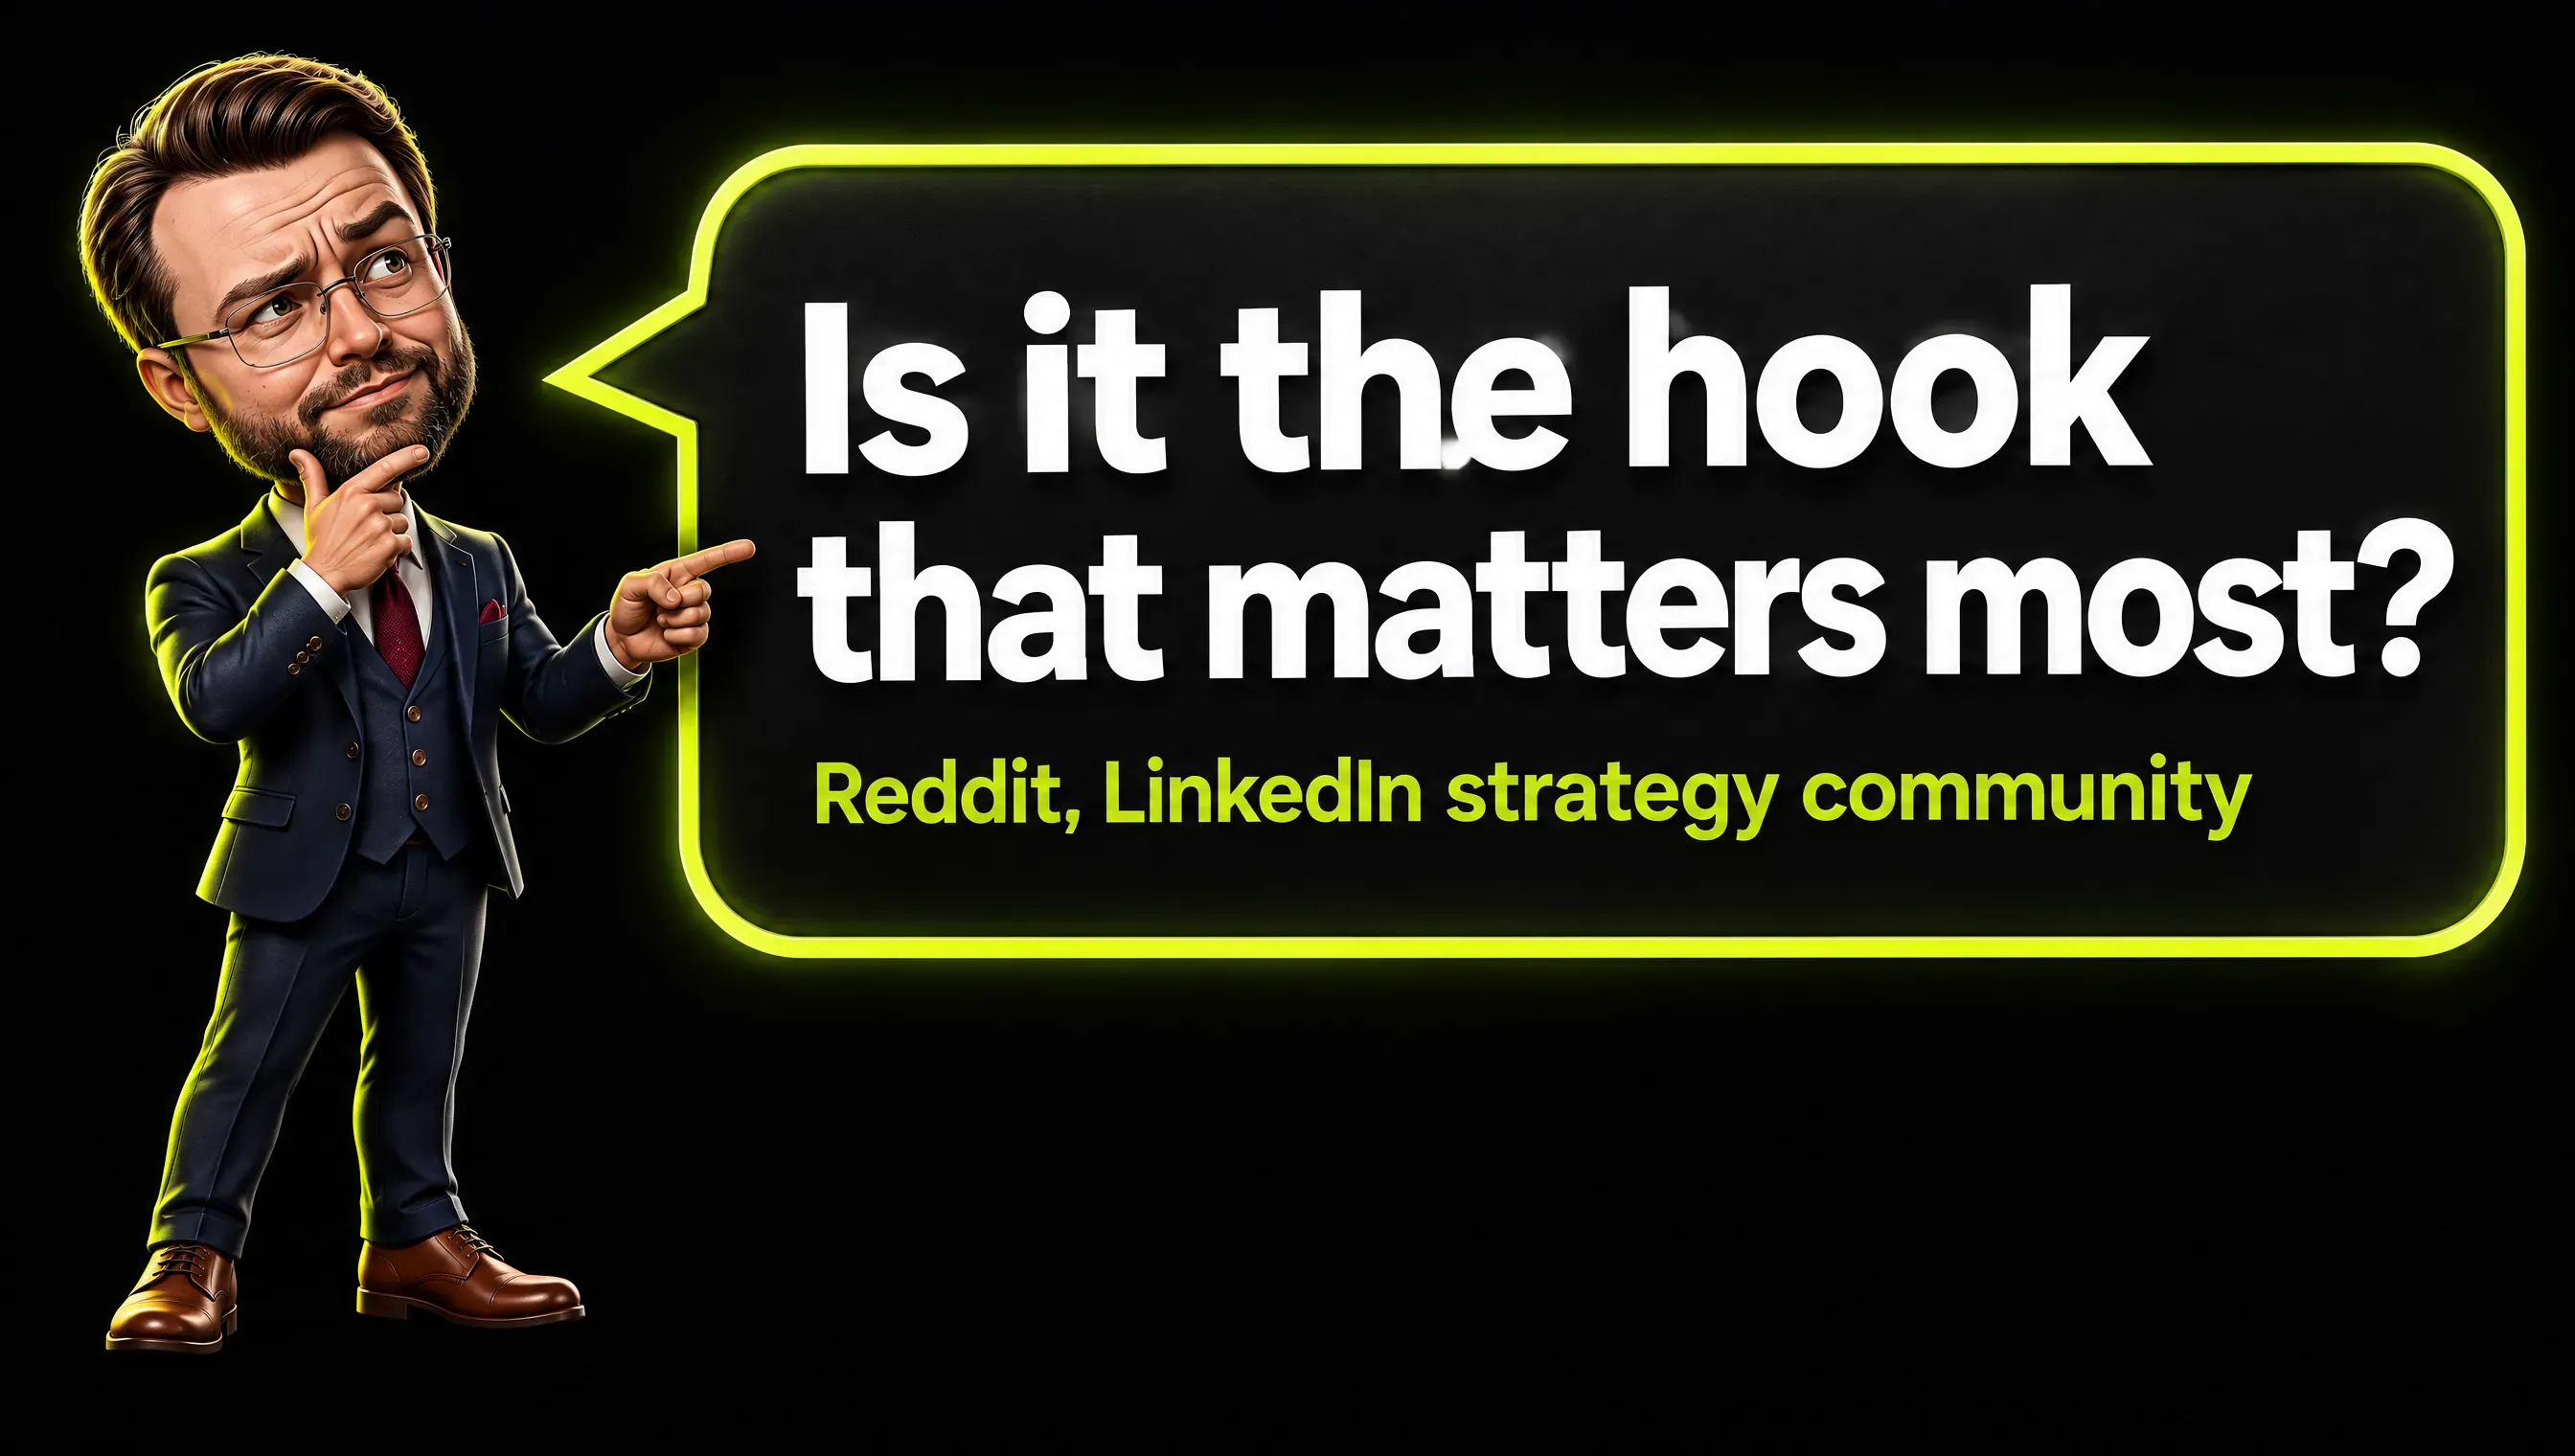
Real question from a Reddit community about LinkedIn strategy.
The question reads: “Some people hit thousands of views on LinkedIn, while others struggle to get 10 likes. Why is that? Is it the hook that matters most?”
The hook is the opening line of a post. None of the studies compared here puts a number on it. They measure frequency, format, length and links, so how much of that gap a better first line would close stays open.
What I can say is that the question compares two different counts on different accounts. A thousand views mean one thing for a large audience and another for a small one.
So my answer is to compare each post with your own earlier ones, not with other accounts. The hook is also a good candidate for the experiment weeks: one group of posts with one kind of opening against a second group with another.
Frequently Asked Questions
What is a content strategy?
A content strategy is the set of decisions behind what you publish: the goal, the reader, the themes, the rhythm, the format and the review date. On LinkedIn it fits on one page.
What are LinkedIn best practices?
LinkedIn’s help page on best practices for sharing content points to an official resource and gives no posting formula. As of November 2026, the help pages I read state no number of posts per week, while LinkedIn’s page for creators advises 2-5.
What kind of content does well on LinkedIn?
Two studies from 2026 rank documents and carousels ahead of plain text, and a third ranks them ahead of images and video, each with a different formula and sample. The order is a useful hint, while the percentages cannot be compared.
How often should you post on LinkedIn?
LinkedIn’s page for creators advises 2-5 posts per week, and the help pages I read state no number. A Buffer analysis of more than 2 million posts names the same range as a place to start. Its two readings disagree on what more posts do to the reach of each post.
How do you plan a LinkedIn content calendar for three months?
Write the goal, the reader and three or four themes, then plan the weeks in phases: calibrate, find a rhythm, test one change at a time, review. LinkedIn’s scheduler accepts posts from 10 minutes to 3 months ahead.
How do you measure whether a LinkedIn content strategy works?
Compare each post with your own earlier posts in creator analytics, which all members can open. Then count by hand the signal that matches your goal, such as conversations with the right people.
What matters more, the format or the reader?
The reader. Format studies disagree on the numbers, and two of the three I compared describe company Pages or brands. A clear reader decides the themes, the words and what counts as a good result.
How many content themes should a LinkedIn content plan have?
I suggest three or four. My own written plan lists more, with shares that stay hypotheses until there are enough posts to compare.
LinkedIn Content Strategy in Short
A LinkedIn content strategy is one page of decisions about goal, reader, themes, rhythm, format and review date. The studies give you ranges to start from, and your own analytics tell you after three months which decisions to keep.
I write about marketing, AI and the numbers behind them. If this was useful, follow me on LinkedIn.