LinkedIn Impressions: What the Number Counts, Why It Drops, and What to Report Instead
LinkedIn impressions count how often a post was shown, not how many people saw it. Official definitions, engagement rate formulas, benchmarks, a drop checklist.

LinkedIn impressions are the first number you see under a post, and the one most often misread. An impression is a count of times a post was shown. It is not a count of people, and LinkedIn itself calls it an estimate.
That difference changes how you read everything built on top of it. The same post can have an engagement rate of 6% or below 1%, depending on which formula you pick, and public benchmarks do not use the same one.
I work as a Marketing Engineer: Digital since 12, full Marketing since 20. Measurement is the part of the job I trust most, so this guide reads the official definitions line by line, compares the benchmarks with their formulas, and ends with what to report to the person who decides.
Key Takeaways
- An impression is a display, not a person. LinkedIn defines it as the “number of times your post was shown on LinkedIn”, repeat views included.
- Members reached counts people. It is the number of distinct members and Pages that saw the post, and LinkedIn says it “does not include repeat views”.
- The numbers are estimates. LinkedIn states that post analytics “may not be precise”, and your own views are counted too.
- Engagement rate has no single formula. LinkedIn publishes one for Pages, with clicks in it, and benchmark reports use at least three others.
- A drop needs a checklist before a theory. Fewer posts, uneven periods and one past outlier can explain a drop before the algorithm does.
- Report people and actions. A decision maker needs members reached, useful actions and the formula written next to any percentage.
What Is an Impression on LinkedIn? The Short Answer
An impression is one display of your post on a screen. If the same person sees the post three times, that is three impressions.
LinkedIn’s help page on post analytics defines the metric for members as the “Number of times your post was shown on LinkedIn.” The page on combined post analytics adds a warning: “The number of times your post was displayed on screen. This number is an estimate and may not be precise.”
So the number answers one question: how many times did LinkedIn put this post in front of someone? It does not say how many people that was, how long they looked, or whether they read a word.

Does a Post Have to Be Fully Visible to Count?
No rule of that kind is written for every post. You will often read that an impression needs 50% of the post on screen for 300 milliseconds, and LinkedIn writes that threshold in one specific place.
It appears in the guide to content analytics for a LinkedIn Page, in the mobile section: “Shows the number of views your content receives when it’s at least 50 percent on the screen for 300 milliseconds or more, or when it’s clicked.”
The desktop section of the same page uses the general wording, a post “shown on LinkedIn”. The help pages for personal profiles that I read on November 13, 2026 give no screen or time threshold, so I state the rule only for Page content on mobile.
Impressions vs Members Reached: Displays and People
LinkedIn shows a second number that counts people. The help page defines it: “Number of distinct members and Pages that saw your post. This number is an estimate and does not include repeat views.”
A second help page on how these metrics are calculated puts the two side by side: “Impressions represent the number of times your post was displayed on screen. Members reached represent the number of members your post was displayed to at least once.”
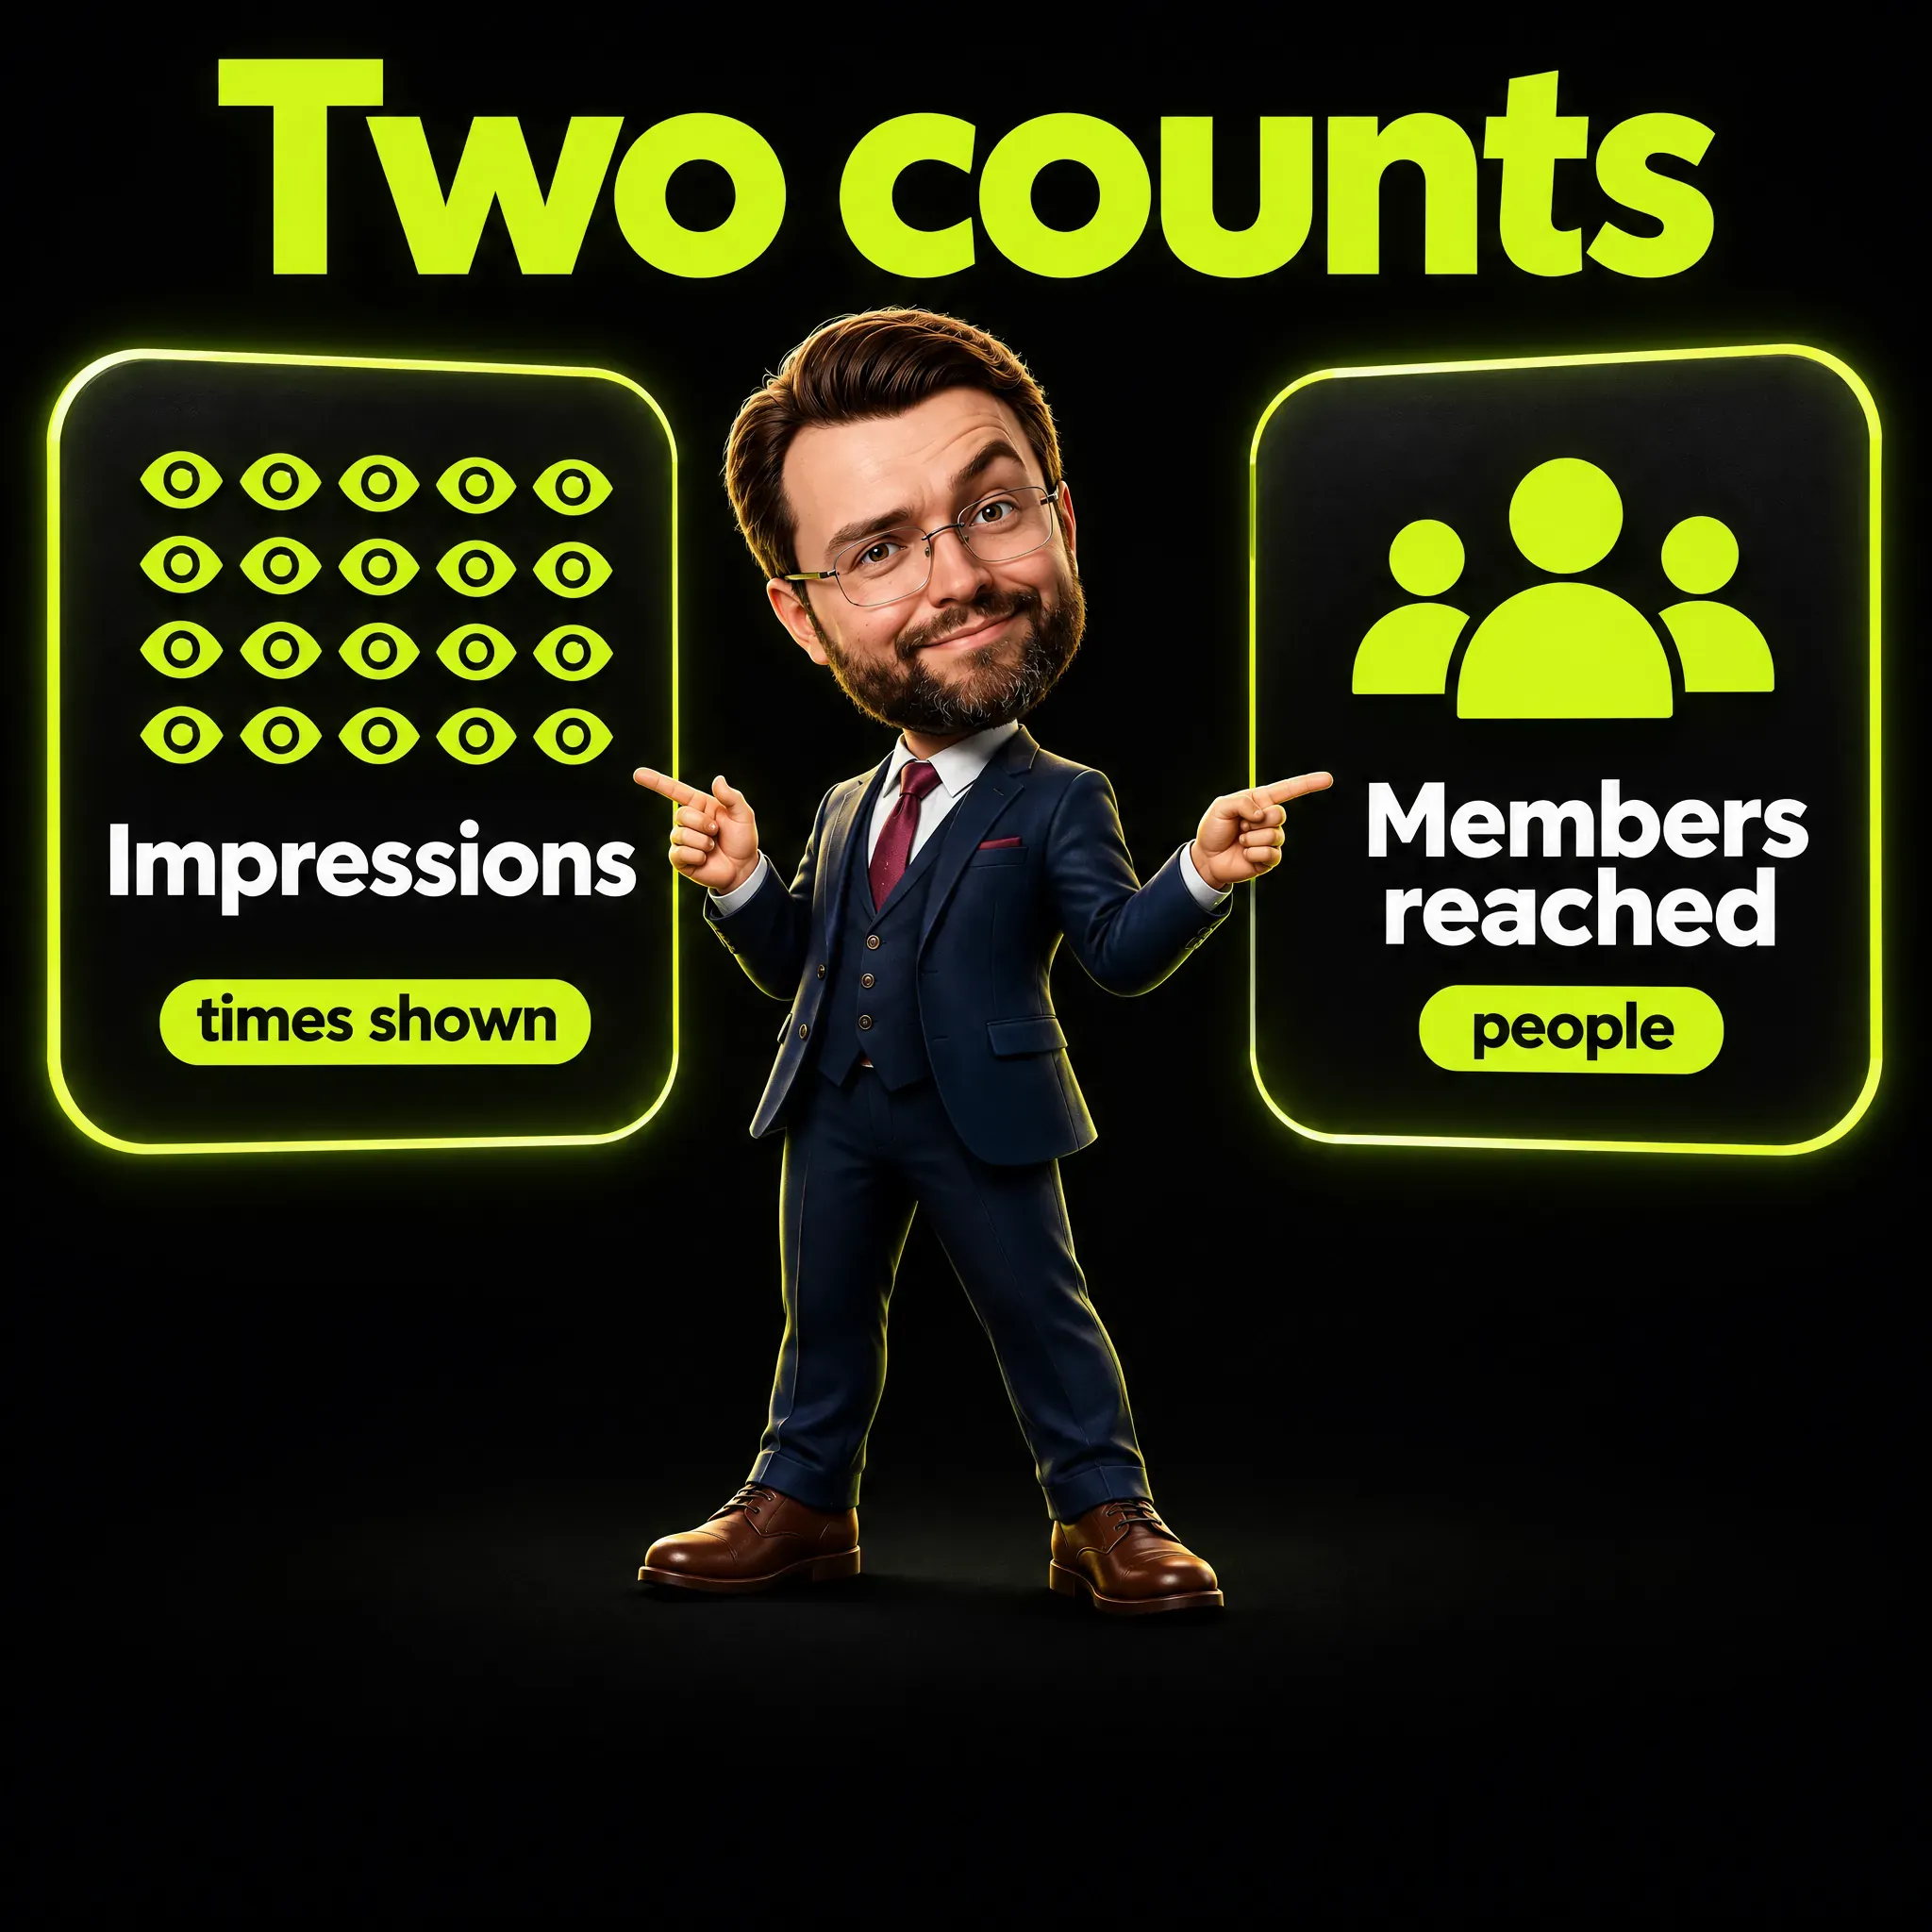
How far apart are the two? AuthoredUp, a vendor of a LinkedIn tool, analyzed 476,465 posts of personal profiles that use its product, published from September 2025 to February 2026. On the 42,493 posts that carried both metrics, it reports: “In our data, the median post’s members reached is about 46% of its impressions”.
In that sample, a typical post with 1,000 impressions reached fewer than 500 people. The data comes from one tool’s users, so I treat it as an order of magnitude and not as a constant.
If you search for “unique impressions”, this is the idea behind it. In the analytics interface the name is members reached, and in LinkedIn’s developer documentation for organization posts the field is described as the “Number of unique impressions.”
Do Your Own Views Count as Impressions?
Yes. LinkedIn writes: “Your own views, social engagements, link engagements, saves, and sends are counted towards the analytics of your content.”
For a post with thousands of impressions this is noise. For a post with 80 impressions, the five times you opened it to check the comments are a visible share.
Three more limits come from the same help pages:
- The figures are estimates. “Please note that the numbers in your post analytics are estimates and may not be precise”.
- Demographics are protected. Because of privacy protections on audience data, LinkedIn says “numbers may not be precise.”
- Nobody else sees them. “Your post analytics are private to you.”
How LinkedIn treats bots or accidental scrolls is not written on those pages.
Are LinkedIn Impressions the Same as Views?
No, and the word “view” changes meaning with the format. This is where many reports mix numbers that cannot be added.
Video. For a personal profile, LinkedIn counts “The total number of times your video was watched for two or more continuous seconds, including replays.” A video can collect impressions in the feed without collecting views.
Articles. Article views are “The total number of times your article was seen on LinkedIn or via email.”
Newsletters. The help page on newsletter analytics separates the two counts. Impressions are “The number of times your newsletter editions were displayed on screen”, while an article view requires that a member clicked on an edition to open it.
Comments. Comments have impressions too, and LinkedIn explains on its page about comment analytics: “A comment impression is counted each time someone views your comment.” It adds that “Comment impressions are not shown in any dashboard.”
Organic and Paid Impressions
Organic impressions come from unpaid distribution. For personal profiles LinkedIn splits them in two: in network is the “Percentage of impressions from members who follow or are connected to you”, and out of network is everyone else. Paid impressions come from sponsored content and are reported in Campaign Manager, LinkedIn’s advertising tool.
The two meet in a few places, and that can confuse a report. For Pages, LinkedIn defines video views as “The total number of times your video was watched for more than 2 seconds, including sponsored and organic views.”
If a campaign ends, that total falls even when nothing changed in the organic distribution. Paid campaigns also carry their own definition of engagement rate, which I cover below.
Where to Find Your Impression Data
Personal profile. Under each post, the analytics link opens the detail for that post. A second view covers all your posts together: LinkedIn confirms that “All LinkedIn members have access to combined post analytics”, found under Analytics & tools, with a date range from the past seven days to the past 365 days and an export to an .XLSX spreadsheet file.
For each post, a member sees impressions, members reached, reactions, comments, reposts, saves, sends, profile visitors from the post, followers gained and audience demographics. Link clicks are there as well: “The total number of times members and Page admins clicked on an external link in your post, including repeat clicks.”
Company Page. Page admins see impressions, members reached, clicks, click-through rate, engagement rate, reactions, comments, reposts and video views. One line matters for anyone who reads the numbers the next morning: “It might take 48 hours for metrics to be reflected, except for reactions and comments which reflect in real time.”
How long the data stays, for members: video analytics for 365 days, article and newsletter analytics for two years, and for all other content types “discovery and social engagement counts are available for 1,000 days. Members reached data is available for 400 days. Demographic breakdowns are available for 180 days”.
A newer table of recent posts is being rolled out on desktop. LinkedIn notes that “The metrics for each post are lifetime totals”, so a post from yesterday and a post from last month are not at the same stage.
How to Calculate Engagement Rate From Impressions
For organic posts, LinkedIn publishes an engagement rate only in Page analytics. The definition is: “Shows the ratio of interactions per impressions on your post. Interactions include clicks, reactions, comments, and shares.”
As a formula:
Page engagement rate = (clicks + reactions + comments + shares) / impressions
The help pages for members that I read contain no engagement rate. If you have a personal profile, you calculate it yourself, and you must choose what goes in.
The word “engagements” does not help, because it means two things. For a profile it is the total “including reactions, comments, saves, sends, and reposts.” For a Page it “includes clicks, reactions, comments, and reposts.”
So a profile counts saves and sends and leaves clicks out. A Page counts clicks and, in the text I read, not saves and sends.
Campaign Manager has a third definition for ads: “Number of times member accounts interacted with your ad (paid and free clicks divided by total impressions).” Organic and paid rates should not sit in the same column.
One Post, Five Percentages
An example with invented numbers shows the size of the problem. Take a post on a Page with 12,000 followers: 4,000 impressions, 1,800 members reached, 130 clicks, 90 reactions, 14 comments and 6 reposts.
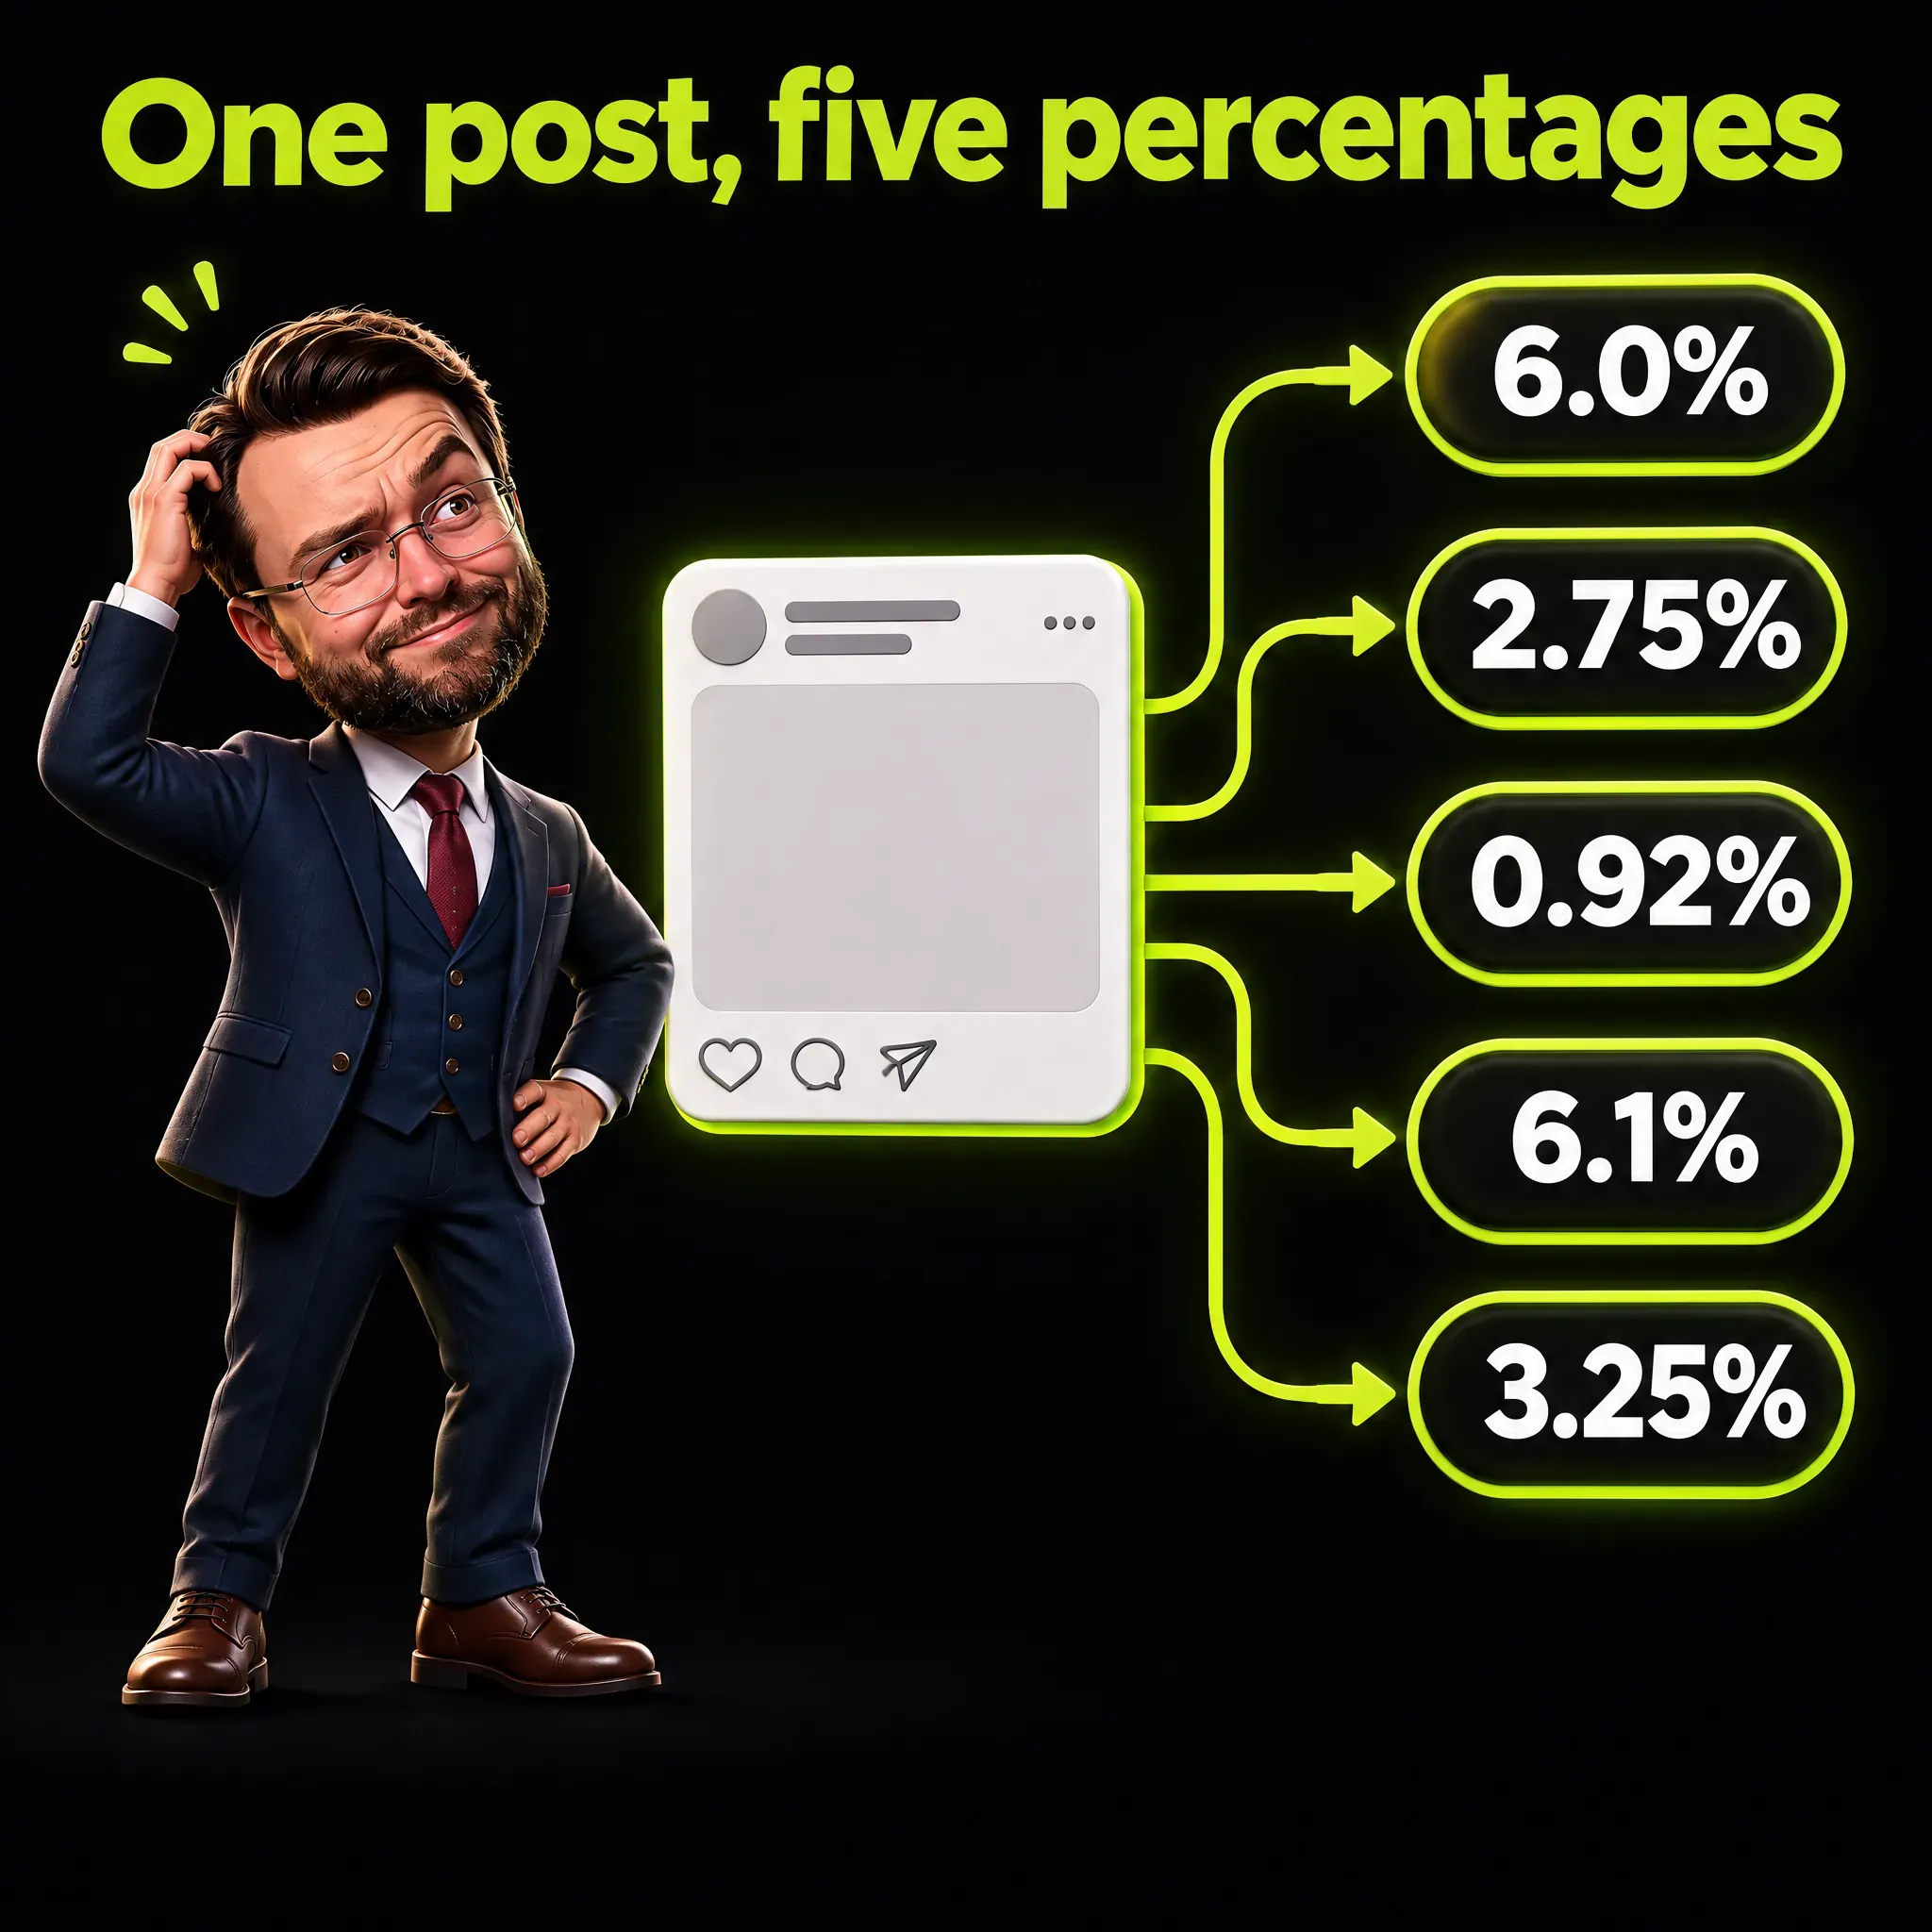
| Formula | Calculation | Result |
|---|---|---|
| Page engagement rate, clicks included | 240 / 4,000 | 6.0% |
| By impressions, without clicks | 110 / 4,000 | 2.75% |
| By followers, without clicks | 110 / 12,000 | 0.92% |
| By members reached, without clicks | 110 / 1,800 | 6.1% |
| Click-through rate | 130 / 4,000 | 3.25% |
6.0% and 0.92% describe the same post. If you compare the first with a benchmark calculated on followers, you congratulate yourself for nothing.
One more figure comes from the same data: 4,000 impressions over 1,800 people is about 2.2 displays per person reached. That is the repetition hidden inside every impression count.
What Is a Good Engagement Rate on LinkedIn?
There is no single good value, because the public benchmarks use different formulas and samples. Here are four I read, each with its method.
- Socialinsider. 2.45 million posts from 26,000 company pages. An average of 5.20% by impressions in 2025, where engagement is “reactions, comments and shares divided by impressions”. Clicks are not in it.
- Vista Social. 7,238 LinkedIn brand accounts, August to October 2026. A median of 5.8% by impressions, with the lowest quarter at 2.6% and the top quarter above 11.0%.
- Buffer. Over 52 million posts published through Buffer on ten platforms, with 2025 data and a LinkedIn median of about 6.2%. Buffer divides engagements by reach, “where reach is the number of unique accounts that saw the post”, and notes that “LinkedIn, for example, includes clicks in its engagement rate, while most other platforms don’t”.
- Hootsuite. An average of 3.9% for LinkedIn, calculated on followers: “Formula: (Total engagements / Followers) x 100”.
The most instructive pair sits inside one report. Vista Social calculates both versions on the same 7,238 brand accounts: the median is 5.8% by impressions and 1.0% by followers.
Hootsuite’s 3.9% by followers does not contradict that 1.0%. Hootsuite describes its figures as reflecting “each platform’s best-performing content type”, and it reports an average, while Vista Social reports the median brand profile across all its posts.
Buffer adds the sentence I would put above every benchmark table: “(We wish universal benchmarks existed. They don’t.)”
If you need a working answer: for a company page measured by impressions, the reports above put a typical value roughly between 5% and 6%. Measured by followers, Vista Social’s median is 1.0%.
Is 1,000 Impressions on LinkedIn Good?
It is a little above the typical post in two third-party data sets, and your own history is the better yardstick. Both data sets come from tool vendors.
A Metricool study of over 670,000 posts, as covered by Net Influencer, found an average of about 832 impressions per post for company pages and about 818 for personal profiles. AuthoredUp puts the median post of a personal profile at about 840 impressions.
Now count people. With the 46% ratio seen above, 1,000 impressions means about 460 people. That is below the 636 people AuthoredUp measured for a typical post at the end of May 2025.
The comparison that helps is with your own history. Take the median impressions of your last 20 posts in the same format, which is the middle value when you sort them, and judge a new post against that.
Why Did Your LinkedIn Impressions Drop? Checks Before Theories
When impressions fall, the first instinct is to blame the algorithm. I would check eleven things first, in this order.

The first five checks. The full list has eleven.
- Fewer posts in the period. Compare impressions per post, not the total.
- Uneven post age. In the Metricool study, “Half of a LinkedIn post’s lifetime impressions occur within the first 48 hours”. A post from yesterday cannot be compared with one from last month.
- Data not complete yet. For Pages, metrics can take 48 hours to appear.
- An outlier in the previous period. One exceptional post lifts an average. Look at the median.
- A change of format. Socialinsider reports for video “a 36% YoY decline in views”, where YoY means year over year, and AuthoredUp measures different drops for video, documents, images and text.
- In network and out of network. For personal profiles LinkedIn shows the split per post. If the out-of-network share fell, fewer impressions came from people who do not follow you.
- Fewer reposts and sends. These are the actions by which readers pass a post on.
- Two metrics read as one. Check whether impressions fell, members reached fell, or both.
- Estimates. Small differences are inside the imprecision LinkedIn declares.
- The end of a boost or a campaign. Page metrics cover organic and sponsored posts together, so the totals fall when paid distribution stops.
- The platform context. Several third-party studies measure a decline between 2024 and early 2026, and one measures growth in 2026. That is context, not proof of the cause of your own drop.
Point one deserves an example, with invented numbers. Month A has 20 posts and 30,000 impressions, which is 1,500 per post. Month B has 12 posts and 19,200 impressions, which is 1,600 per post.
The total fell by 36%. Impressions per post rose by almost 7%. The drop came from the calendar and not from distribution.
Is Organic Reach on LinkedIn Declining? The Studies Disagree
Third-party studies disagree, and LinkedIn has published no general figure.
The best-known decline comes from AuthoredUp, in July 2025: “We analyzed 3,000,000 LinkedIn posts from 30,000+ personal profiles”. Its finding: “In June 2024, the typical post reached 1211 people. By the end of May 2025, that number dropped to 636.”
Metricool points the same way for company pages. In the coverage by Net Influencer, which compares January and February of 2025 and 2026: “Average impressions on LinkedIn Company Pages dropped 10% year over year”.
Another study says the opposite. Magnettu analyzed 16,790 posts from 689 brands between January and July 2026 and titled its first result “Finding 1: LinkedIn reach is not declining”.
Among the 345 brands that posted consistently, average views per post rose from 1,678 in January to 3,129 in June. Magnettu adds a caution about its own peak: “June is a peak, not a new baseline”.
The studies do not cancel each other. They cover different accounts in different periods: personal profiles that use one tool from 2024 to 2025, company pages in early 2025 and 2026, and brands from January to July 2026. None of them is LinkedIn’s data.
The closest is a statement on video, reported by Digiday. A LinkedIn representative “acknowledged that the performance of some creators’ individual videos had gone down”, and described it as part of the natural fluctuation that comes with tests and changes to the video strategy.
A Real Comment: Impressions Down, Engagement Rate Fine
In a public thread of the Sprout Social community from March 2025, social media managers compare notes on falling impressions. One of them describes the pattern in two sentences.
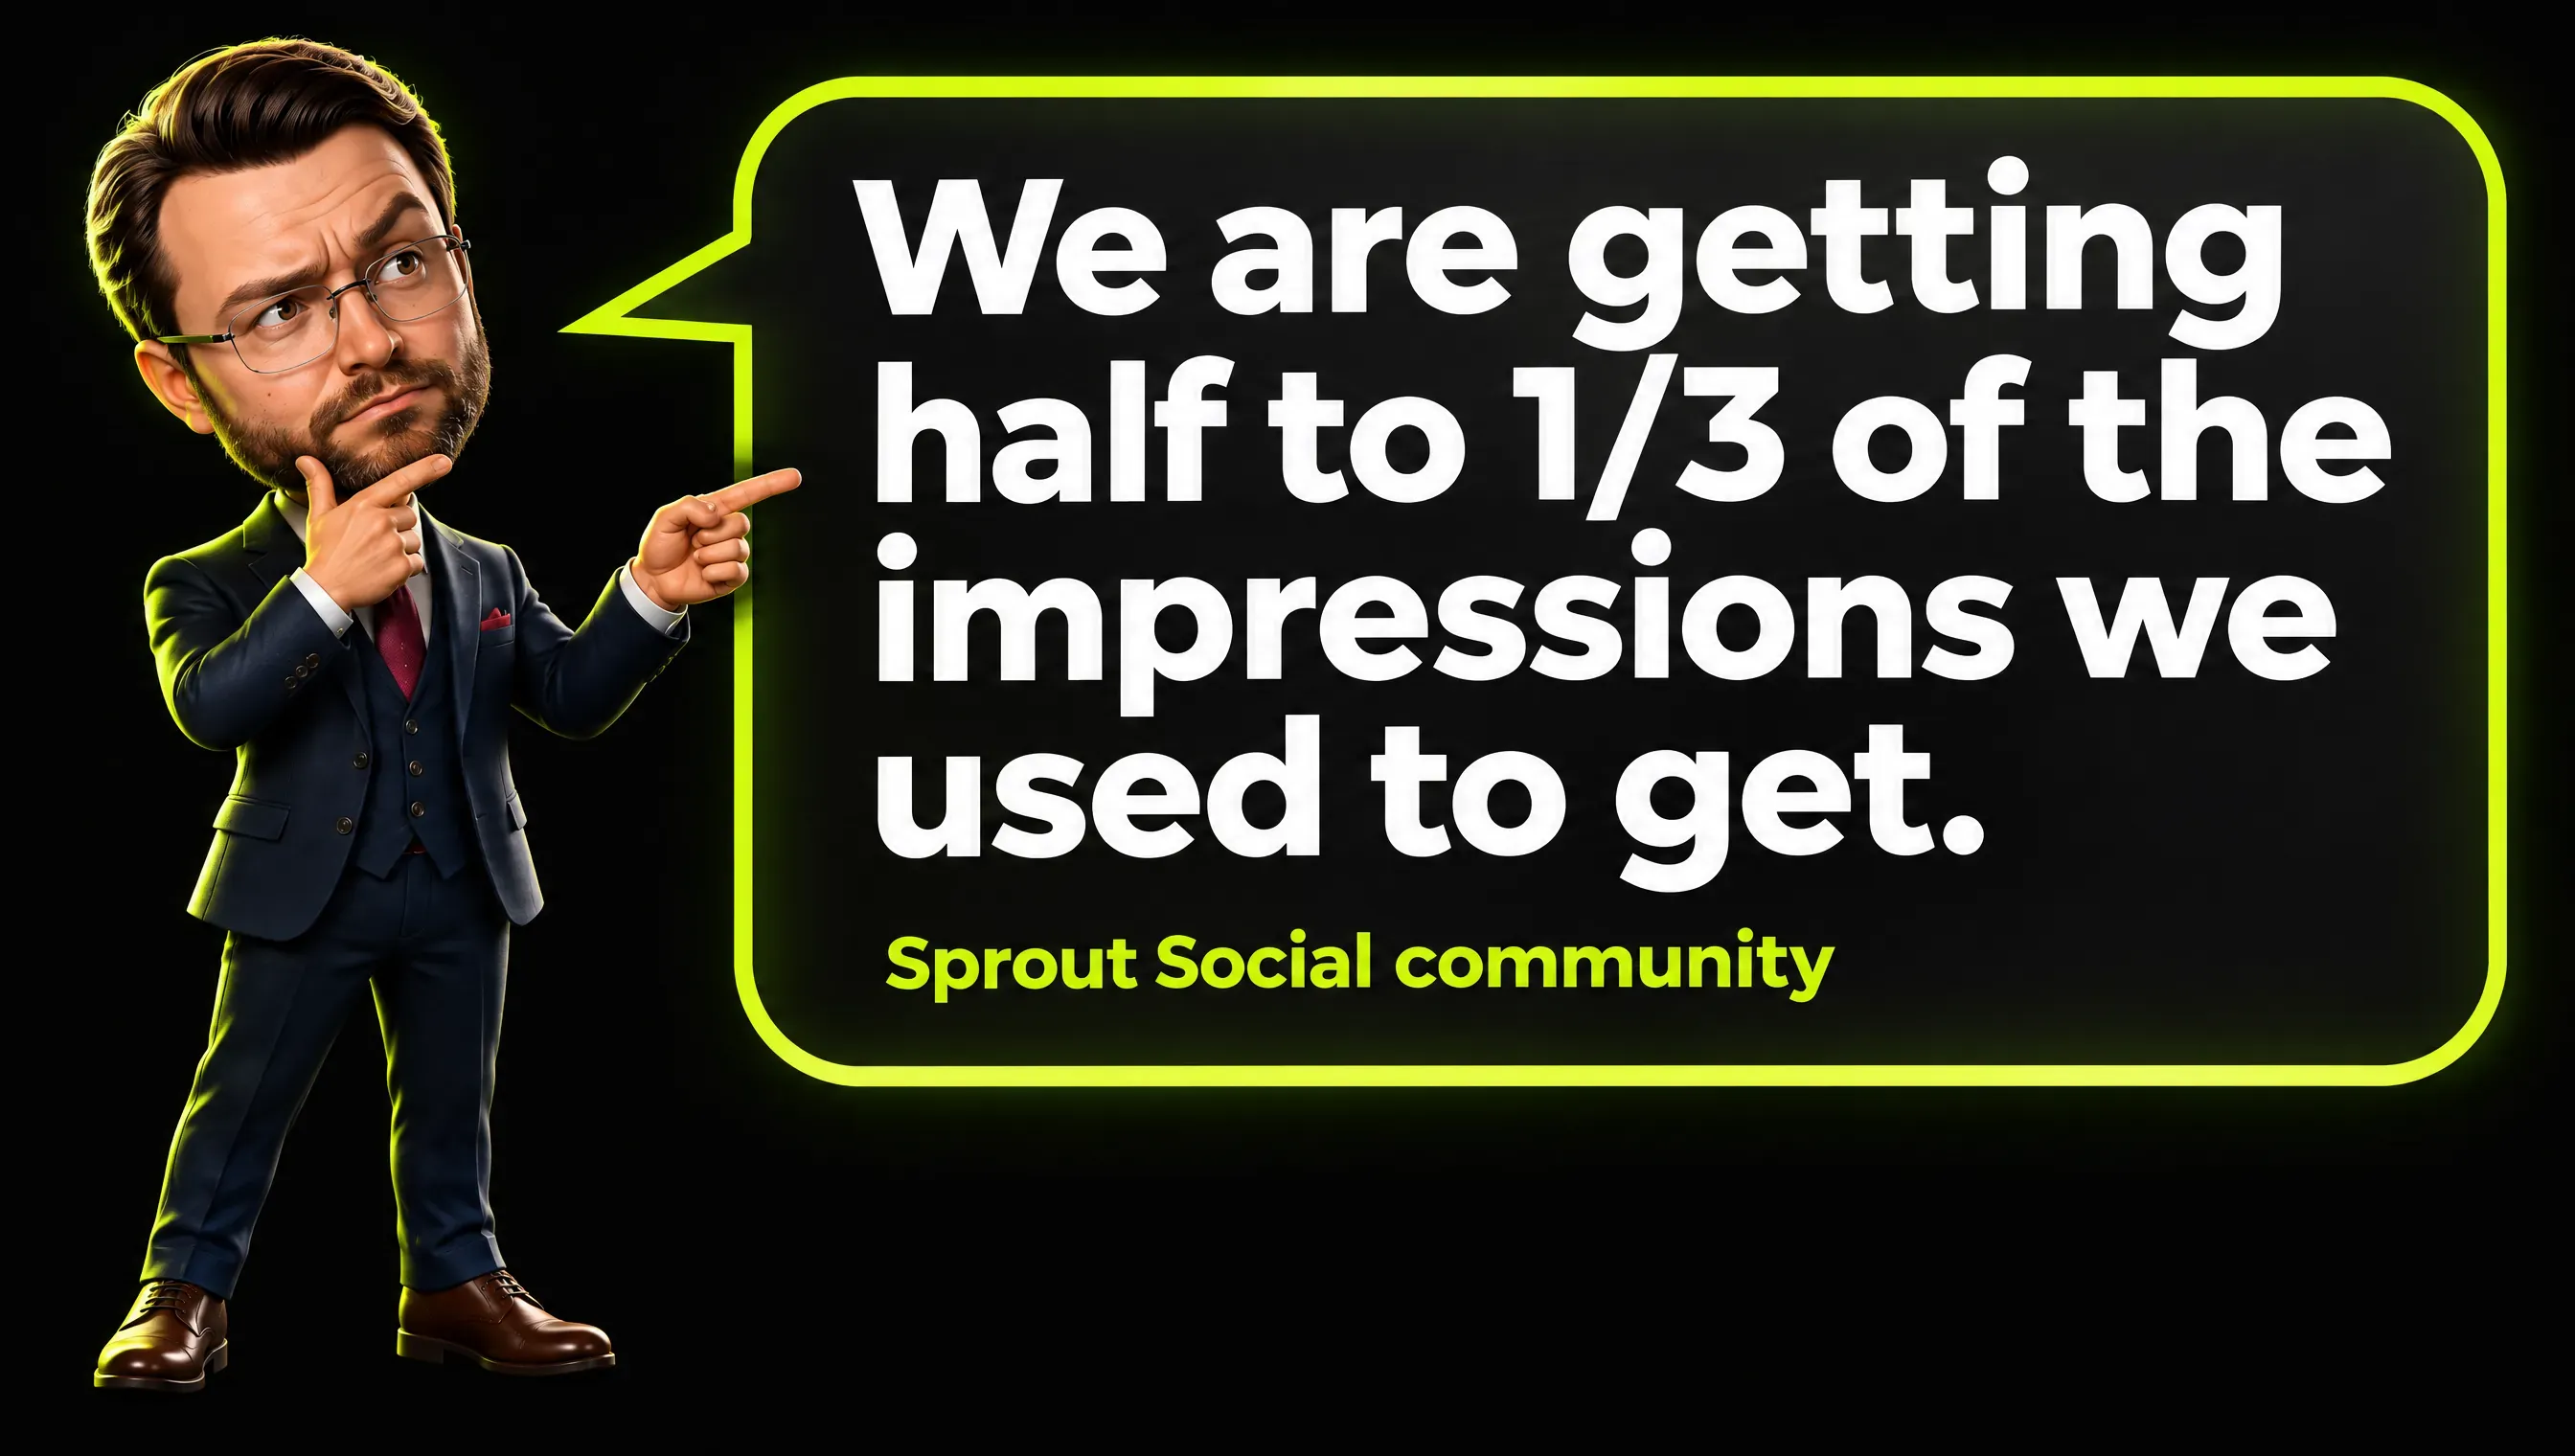
Real comment from the Sprout Social community forum.
The comment reads: “We are getting half to 1/3 of the impressions we used to get.” And a few sentences later: “With this being said we still have an excellent ER and CTR”. ER is engagement rate, and CTR is click-through rate, the share of impressions that end in a click.
That is not a contradiction. If the rate is calculated on impressions, as the Page rate is, it can hold or rise while the post is shown less often. With invented numbers: 150 interactions on 5,000 impressions is 3.0%, and 110 interactions on 2,500 impressions is 4.4%.
Another participant in the same thread shows why theories need checking: “At first, I assumed the drop in reach was due to including external links, but even posts without any outbound links are now underperforming.”
A third one sounds relieved: “Wow, it’s nice to know it might not be completely my fault.” The checklist above exists to separate what is yours from what is the platform’s.
Part of the platform side is written down, and part is only repeated. In my guide to the LinkedIn algorithm I separate what LinkedIn wrote about the feed from what studies measured, including the open question of links in posts.
How to Increase LinkedIn Impressions Without Chasing the Number
No official page gives a recipe. What the sources support is a short list of things to test, each with a caution.
Publish regularly and compare per post. A steady calendar makes your own median meaningful. I wrote about slots and tests in my guide to the best time to post on LinkedIn.
Watch the actions that pass a post on. Reposts and sends are how readers forward a post to other people. Saves and sends are now visible in post analytics, so you can see which posts people keep or forward.
Treat links as a hypothesis. The Metricool study found that posts with a link had 51% more impressions on company pages and 27% fewer on personal profiles. Those are correlations in one data set, so test them on your own posts.
Choose the format for the content. Format moves the numbers in every study I read, in different directions by year. Pick the format that fits the idea, such as a LinkedIn carousel for a sequence of steps, then compare it with your own median.
Impressions are a means. A post seen 10,000 times by people who will never need you is worth less than one seen 600 times by the right 300 people.
What to Report to the Person Who Decides
Bring three things: the people reached, the useful actions, and one rate with its formula next to it. In my own drafts a number goes in only if the reader gets its logic without being from my trade.

Monthly LinkedIn impressions on their own rarely pass that test. The three things in detail:
- People. Members reached, because it counts people and not events.
- Useful actions. Link visits, profile visitors from posts, followers gained, or conversations started.
- One rate with its formula. If an engagement rate appears, the formula is written next to it.
This is the same structure I describe for a marketing report that opens with the problem solved. What happens after the click is a separate question, the one of marketing ROI, the return on what you spend.
Frequently Asked Questions
What counts as an impression on LinkedIn?
Each time a post is shown on a screen. For Page content on mobile, LinkedIn states a threshold of at least 50 percent on screen for 300 milliseconds or more, or a click.
What is the difference between impressions and members reached?
Impressions count displays, repeats included. Members reached counts the distinct members and Pages that saw the post at least once.
Do my own views count as impressions?
Yes. LinkedIn states that your own views and engagements are counted in the analytics of your content.
Can other people see my post impressions?
No. LinkedIn writes that post analytics are private to you. Other members see public counts such as reactions, comments and reposts.
What are LinkedIn engagements?
For a personal profile, the total of reactions, comments, saves, sends and reposts. For a Page, the total of clicks, reactions, comments and reposts.
What is a good number of impressions on LinkedIn?
There is no official value. One third-party study measured an average of about 820 to 830 impressions per post, and your own median for the same format is the better reference.
What is the 4-1-1 rule on LinkedIn?
It is not a LinkedIn rule. It is a content-mix rule of thumb credited to Andrew Davis of Tippingpoint Labs and Joe Pulizzi, first written for Twitter: for every self-promotional update, share one repost and four useful pieces from other people. Later versions change the details.
How long does LinkedIn keep post analytics?
For members, video analytics are kept for 365 days and article and newsletter analytics for two years. For other content types, counts are available for 1,000 days, members reached for 400 days and demographic breakdowns for 180 days.
LinkedIn Impressions in One Sentence
LinkedIn impressions tell you how many times a post was shown, as an estimate, and nothing about how many people cared. Read them next to members reached, write the formula beside every rate, and compare each post with your own median at the same age.
I write about marketing, AI and the numbers behind them. If this was useful, follow me on LinkedIn.