Marketing Report: Open With the Problem You Solved
How to build a marketing report for clients: open with a problem you solved, show three numbers with their logic, and let people ask why in plain words.

The first thing a client should see in a marketing report is a problem you solved. Most guides start with a list of metrics instead: which key figures to include, which tool to pick, which template to download. Then they show a sample layout, and the page ends exactly where the reader’s problem begins: what goes at the top?
I send marketing reports to small business clients every week. Since October the first thing a client sees is a problem that got solved: what broke, what I did about it, and what came out the other side.
This article is the structure behind that choice. It covers why a client opens a marketing report at all, the five blocks I use, how three numbers can each carry their own logic, and how a report can answer questions in plain words instead of waiting for next month’s PDF.
The client cases are anonymized. The full example near the end is invented, and it says so.
Key Takeaways
- A client reads a marketing report to check that someone is in control. In my experience the numbers come second.
- Open with a problem you solved. Use three lines: what happened, what we did, the result. Facts only, no blame, never an invented cause.
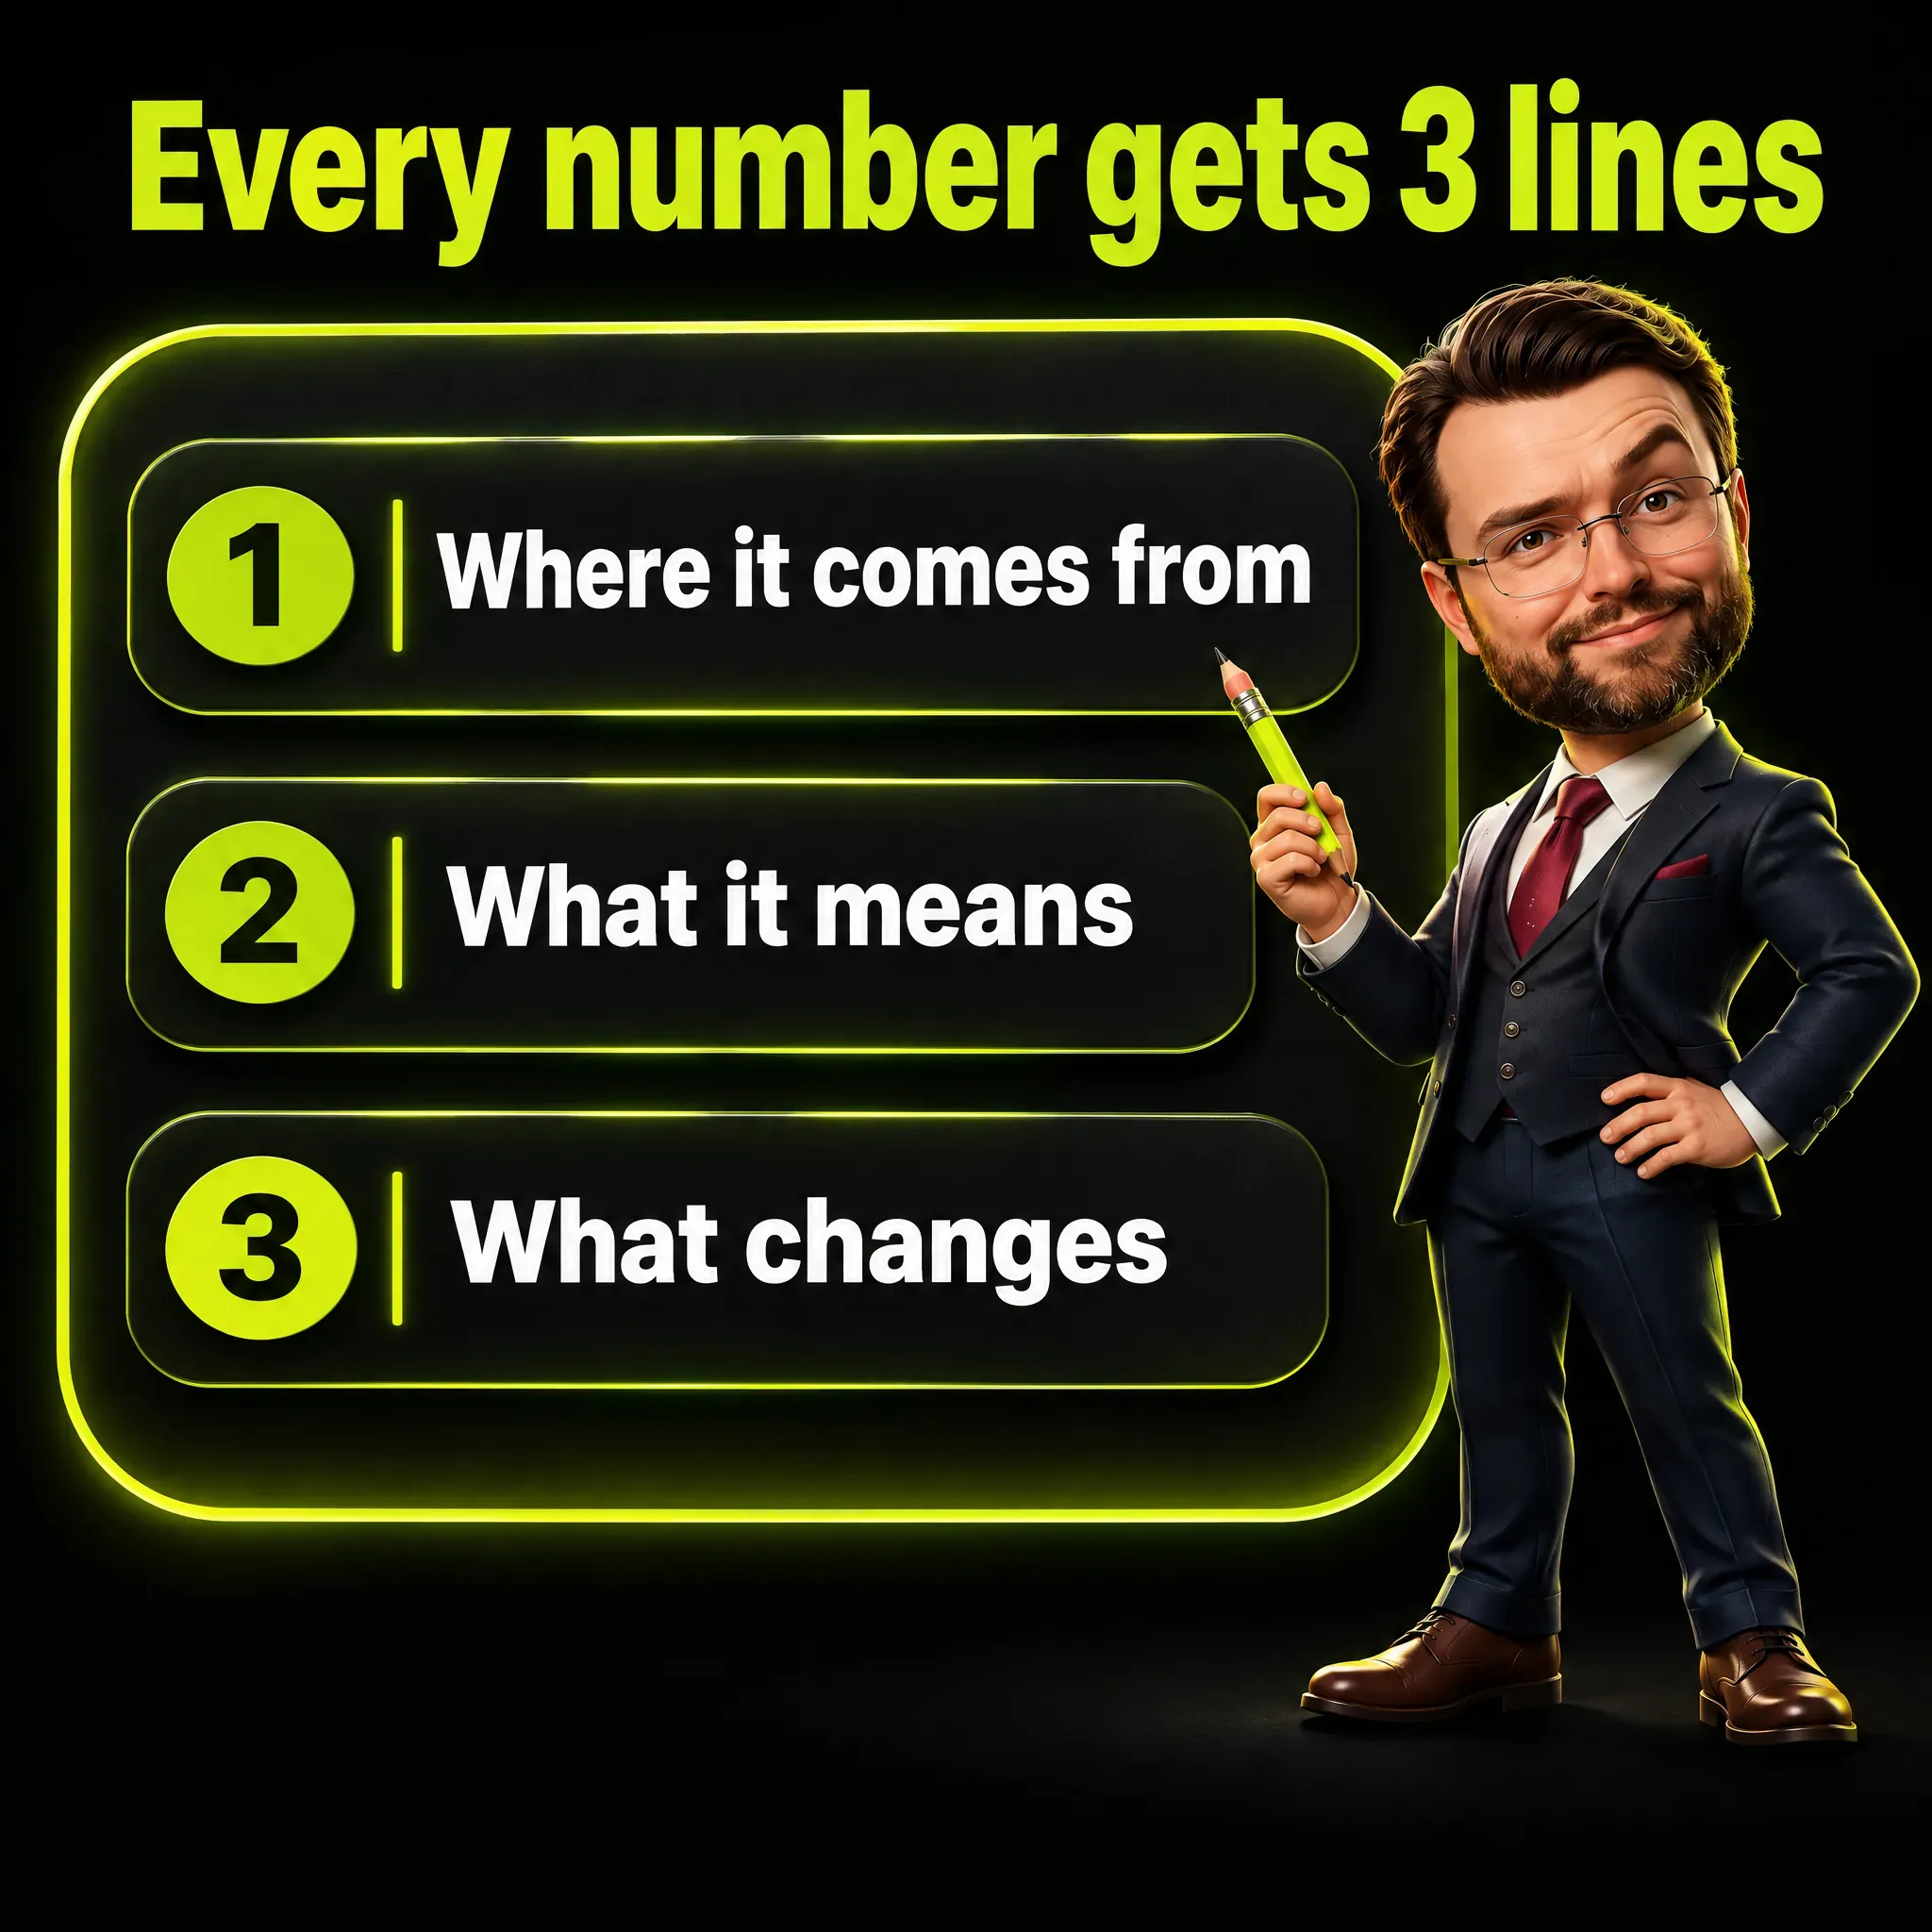
- Show three numbers, not fifteen. Each one gets three short lines: where it comes from, what it means, what changes.
- Count people, not events, and say what you filtered. A visit from a program is not a customer, and a double-counted conversion is a wrong decision waiting to happen.
- Write “n/a” when data is missing, never zero. Zero tells the client nothing happened.
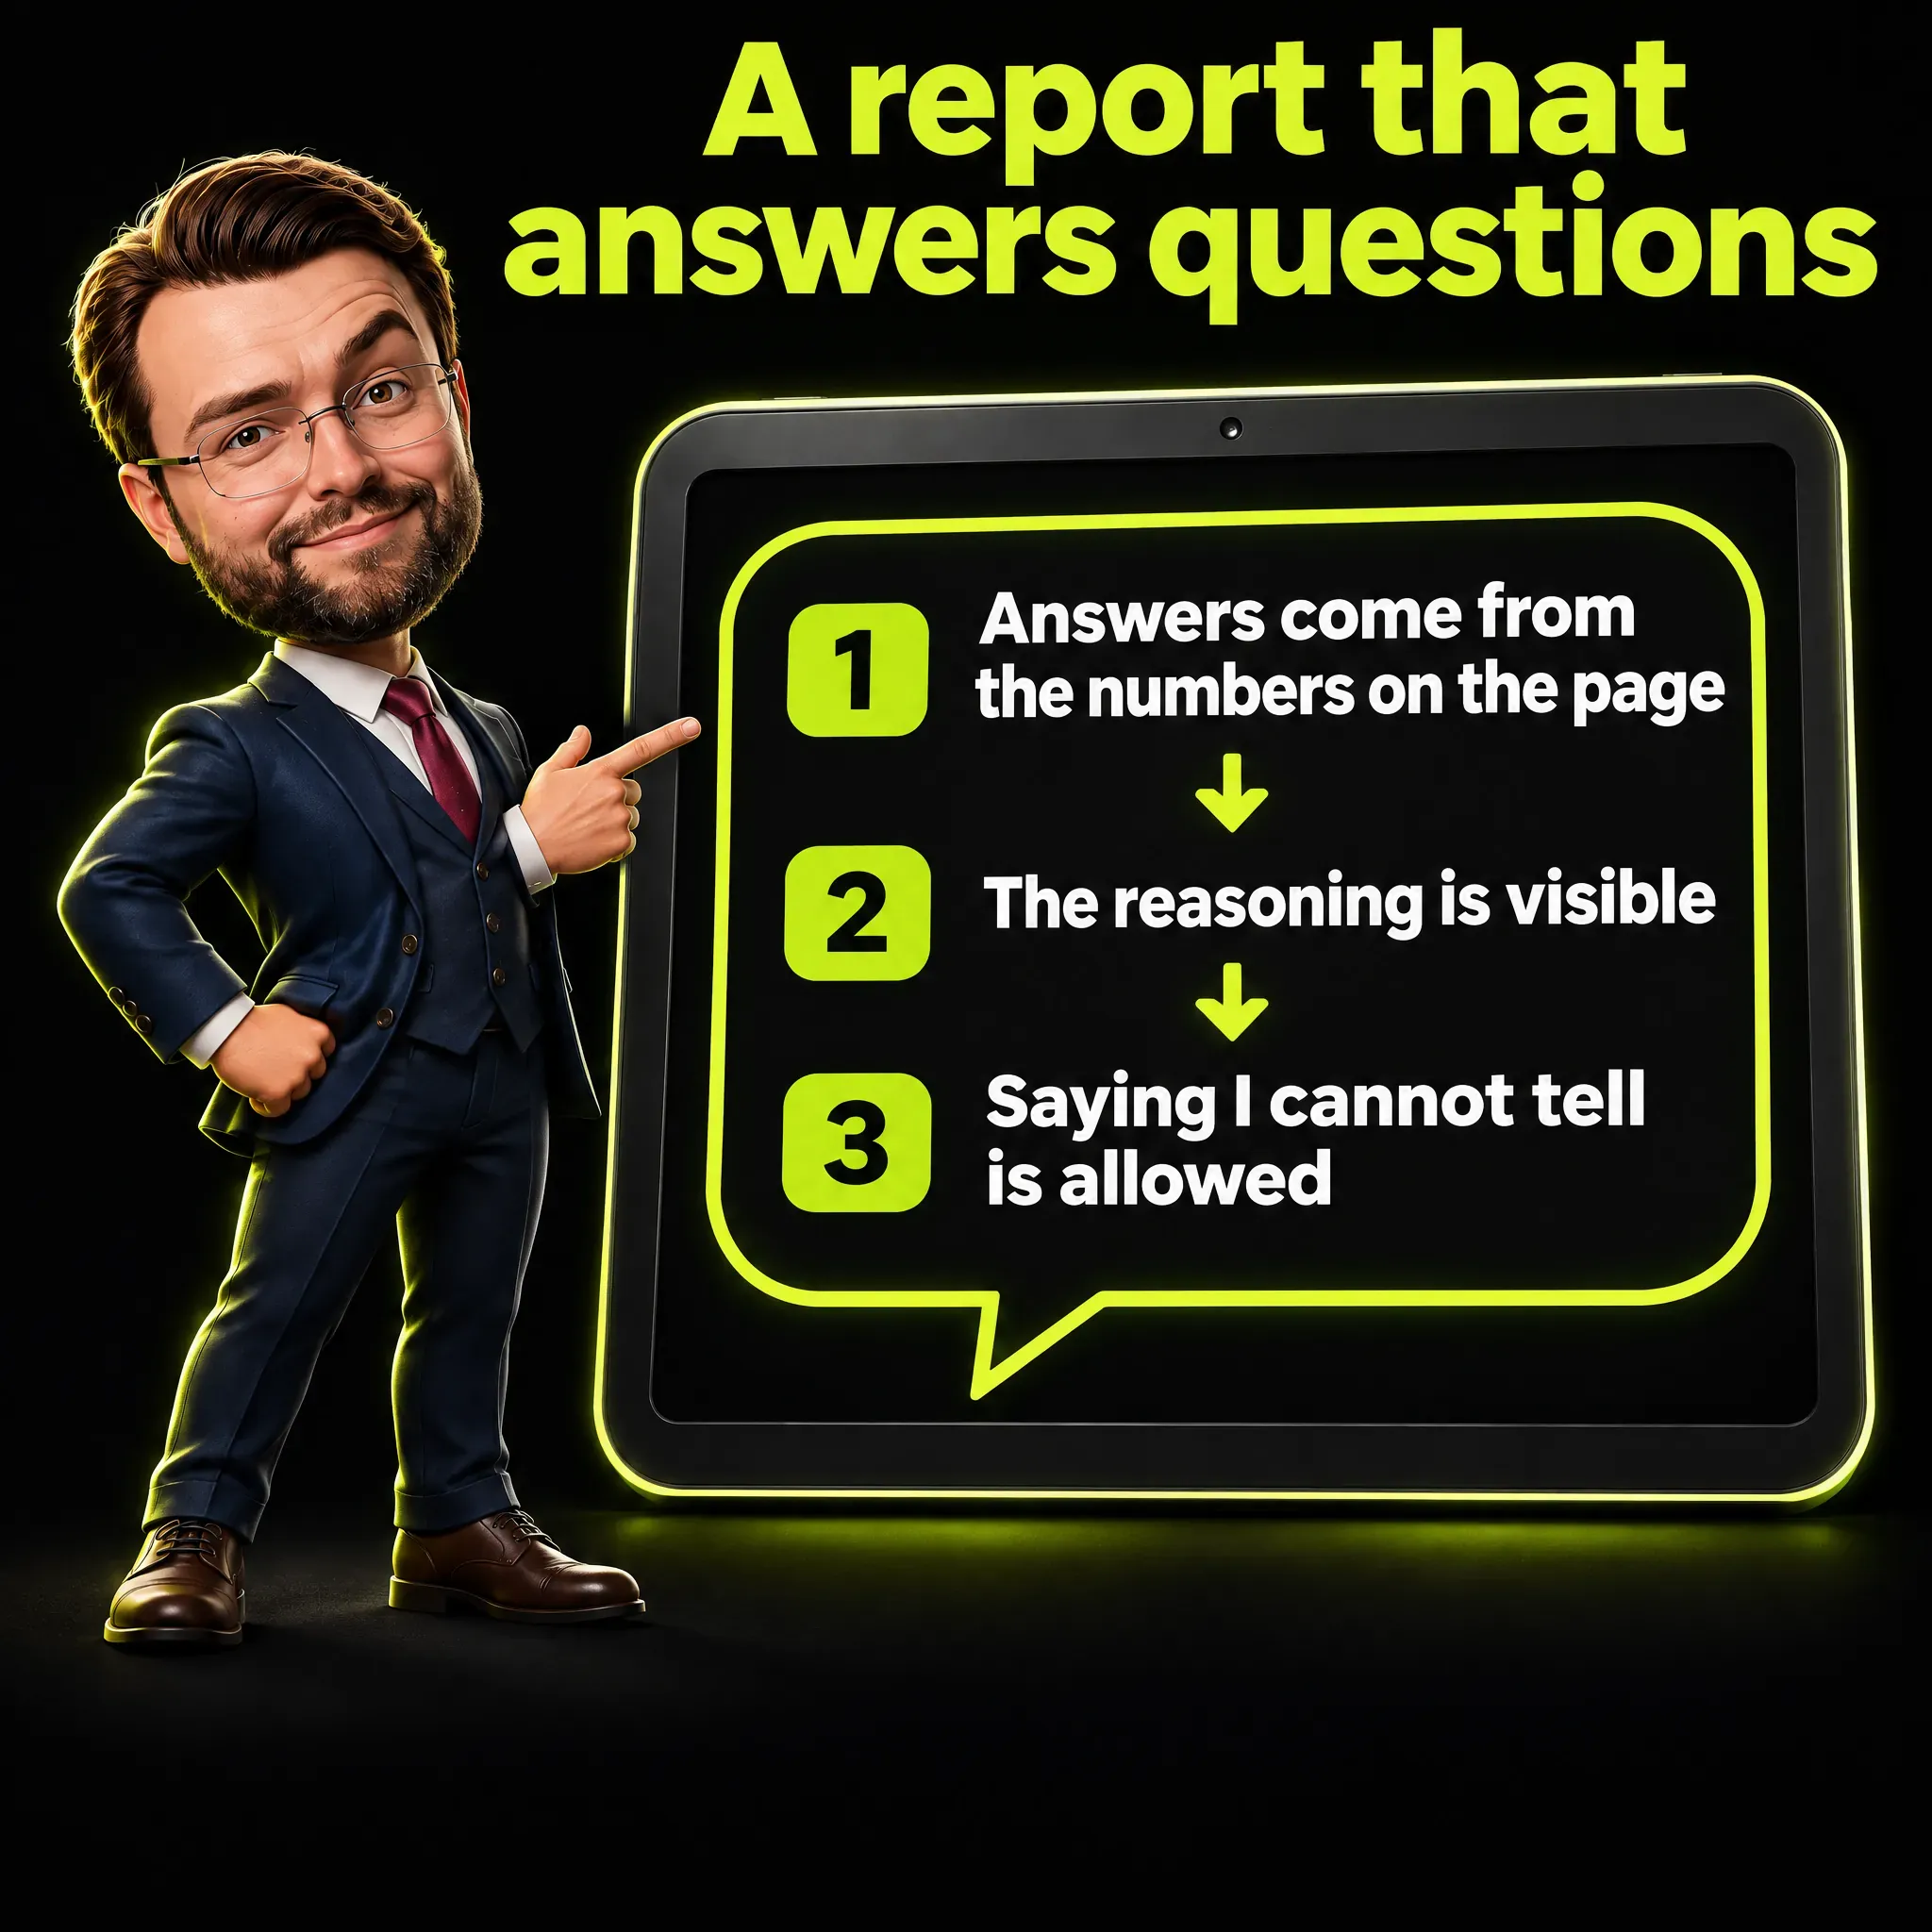
- A report can answer questions. Three rules keep it honest: answers come from the numbers on the page, the reasoning is visible, and “I cannot tell from this data” is an allowed answer.
A Client Reads a Marketing Report to Check That Someone Is in Control
A client who opens your marketing report has one question, usually unspoken: is the person running my marketing on top of this?
That changes what a good report is. A page of clicks, sessions and impressions answers “what happened”, and a client with no benchmark cannot tell whether those numbers are good. A page that shows you saw a problem, handled it and measured the result answers the question they have.
The test I use came from a rule I set for myself in October: if another consultant looked over the client’s shoulder at the report, they should think the author knows what they are doing. The test is about content, not design.
Executives like a single screen of numbers. In January 2017 Joel Shapiro of the Kellogg School of Management opened a Harvard Business Review article, 3 Ways Data Dashboards Can Mislead You, with “Executives love dashboards, and why wouldn’t they?” A dashboard looks finished whether or not anyone checked what is on it.
A screen that looks complete is easy to build. A report that shows the person behind it has checked the numbers takes more care, and that is the one I want a client to find.

Block 1 of the Marketing Report: Open With the Problem You Solved
The first block holds the problems that got solved, each written in three lines: what happened, what we did, the result. The facts are true, nobody gets blamed, the cause is never invented, and the figures are never touched up.
Behind this sits a simple label system in the report generator I built. Every problem I log carries an impact (none, minor, serious), a cause (external, ours, unknown) and a way to say it (in the report, left out, or told directly).
If the impact is serious, meaning real damage like money lost, a site down for long or wrong prices, the report cannot be produced until I have written to the client myself. A client should never learn about a serious problem from the first page of a PDF.
Here is what a solved problem looks like in practice. A local craft business had its ads stop running for reasons on the platform’s side. A lazy report would have said “sessions down 41 percent” and left the client to panic.
The report I sent said the ads had been live on 7 of the 20 weekdays they were scheduled to run, against 20 of 20 in the 28 days before. Per live day, the ads produced 6.0 clicks, against 8.4 before. Almost all of the 41 percent drop in sessions came from the stop.
The cause of that stop, and how it was resolved, is told in my article on customer acquisition cost.
The next report showed contacts going from 1 to 7. Most of those earlier 28 days fell inside the stop, so the report says so right beside the jump, or 1 to 7 looks bigger than it is. Declaring the weak comparison yourself is what turns a good number into a believable one.

Block 2: Three Numbers, Each With Its Logic Showing
A marketing report with fifteen numbers is a wall. A report with three numbers, each explained, gets read. For every number I write three short lines: where it comes from, what it means, and what changes because of it.
The generator pulls its figures from read-only calls to the analytics, search and ads platforms and to the shop; order amounts older than 60 days come from my own archive of daily totals. The sentences that explain a drop are fixed formulas, and a formula skips its sentence when the data is missing. The few numbers I type by hand in a note are rechecked every time the report is regenerated.
Four habits keep the numbers honest: count people, widen the window when the site is small, say what you filtered, and write n/a instead of zero.
The wider setup is in my marketing tech stack, and the three kinds of number I keep apart, measured, derived and assumed, are in how to report marketing ROI.
Count People, Not Events
On one site that collects contact requests, four “lead” events in a period (an event is the record the analytics keeps each time something happens, here a form being sent) turned out to be three form submissions from two people, test contacts included. Ten “intent to book” events were three people, with six clicks from the same one.
So the report counts distinct people. In three lines:
- Where it comes from: people, not events.
- What it means: a repeated click or a doubled event counts once.
- What changes: a doubled event would have told the ad platform twice as many conversions as there were, and the budget follows that number.
The cause of that doubled event was two rules in the tag manager reacting to the same form submission, 50 milliseconds apart. I removed one of them, and the count went from two to one. When you test a setup like this, accept the consent banner first, or the tracking never fires: the rules behind that are in my checklist for tracking consent in Switzerland.
Use a 28-Day Window When the Site Is Small
A small online shop had one week in October with no orders at all. Reported as a week, that is a disaster. Over 28 days the same shop had nine orders, against six in the 28 days before.
- Where it comes from: nine orders counted over 28 days instead of none counted over seven.
- What it means: with few orders, luck weighs more than the trend.
- What changes: the trend is read over 28 days, and the short message to the client still goes out every week.
For seasonal businesses I add a monthly view, month against the previous month and against the same month a year earlier. Searches for a seasonal product can run about three times higher in the right months, so a September report that compares itself with July says nothing useful.
Say What You Filtered
On one lead-generation site, 242 of 525 sessions (a session is one visit to the site) in a four-week period, 46 percent, had the profile of an automated program. The filter removes visits from a short list of countries where data centers sit, and I chose those countries because the visits from there behaved like a program. Almost all of them (98 percent) arrived as “direct” traffic, meaning with no referring site, they viewed 1.00 pages per session and engaged for 0.4 seconds.
Only 5 percent of those sessions counted as engaged, which in Google Analytics means the visit lasted more than ten seconds, or had a second page view or a conversion event. For the rest of the traffic the figure was 52 percent. I cannot prove each visit one by one, so the report calls them what they are: visits with the profile of an automated program.
- Where it comes from: 242 sessions out of 525 with that profile.
- What it means: nearly one visit in two behaved like a program, not a person.
- What changes: the report shows the filtered trend and says what it removed.
The difference is large. With the automated visits and my own test visits removed, the last four weeks show 281 sessions against 464 in the four weeks before, a drop of 39 percent. Unfiltered, 525 against 1,111, the drop would have read 53 percent.
The filter is declared in the footer of the report, so nobody has to take my word for it.
Write “n/a”, Never Zero
If a figure is missing, the report prints “n/a”. Zero would say that nothing happened, when the truth is that the data does not exist. If tracking started in the middle of the window, the label reads “Measured since 23 September” and the earlier period shows n/a.
A box appears in the report only when its data exists. This is the quiet half of honesty in reporting: leaving out a square is better than filling it with a guess.
The same rule holds outside a report. Seven recent analyses of the best time to post on LinkedIn point to different days and hours, and the numbers only make sense once you see what each one measured.
Blocks 3, 4 and 5: What Changes, What I Ask, What Not to Do
The last three blocks are short. Block 3 holds one or two actions already decided, with a date only if the date is real. I never invent deadlines to look organized.
Block 4 is what I ask the client, and it contains business decisions only. The client never gets asked about things I can check myself, such as DNS records, code or API settings.
The form is “I suggest X, a yes or a no is enough”, which keeps the choice theirs and the work mine. When the decision is about money, the framework behind it is in my article on how to set a marketing budget.
Block 5 is one warning: the wrong way to read this report. If a total fell because ads were off for nine days, block 5 says not to read the total as a worse campaign. One warning, because five get skipped.

A Marketing Report That Answers Questions in Plain Words
A marketing report does not have to be a PDF. It can be a page with current data and a box where the client, or the client’s team, types “why did enquiries drop this week?” and gets an answer, without having to learn anything technical. I have tried this on a report of my own.
These are the three rules I want from it. The answer comes from the numbers on the page, not from a guess. The reasoning is visible, so a person can check it. And when the data is not enough to explain the drop, the answer is “I cannot tell from this data” instead of a made-up reason. That is what separates the box from the finished-looking dashboards above: it shows its reasoning and invites the check.
A guess dressed up as a forecast is the same failure, and I cover the forecasting side of it in my honest assessment of predictive analytics in marketing.
Google has built a similar question box into its own tools. In Google Analytics, Ask Advisor (in beta, for eligible accounts) is described as “an agentic conversational experience in Google Analytics, powered by advanced Gemini models”. It handles “Why” questions such as “Why did my total revenue drop on August 1st?”, and its answers rely only on information from the specific Google Analytics property, which is the analytics account of one site.
The same page adds that Ask Advisor “may have some capability limitations and make mistakes”. At the time of writing it is available in properties with English as the selected language.
Data Studio, the product formerly called Looker Studio, has a similar feature. Google calls it “a chat with your data feature” for people with no business intelligence expertise.
Its overview page recommends that you “validate all output” before you use it, and says the Gemini features there are in preview with limited support. A separate help page describes a “Show reasoning” option that, in its words, displays “a plain text explanation of the steps that it took to interpret your query”.
Two practical points come out of those pages. First, the way you ask matters. Google’s guidance for developers building on the same technology says to “be specific and provide context”, with dates, categories or numerical filters, and the Data Studio help page recommends its Thinking mode when you ask why.
Second, the checking never goes away. Whatever tool sits behind the box, a person has to be able to verify the answer, which is the principle behind my article on human-in-the-loop AI verification. The wider picture of where I use AI in my own work is in using AI for marketing.
The Five Blocks of a Marketing Report, Filled In
Here is the whole marketing report in its five blocks. The numbers below are invented, for an imagined repair shop with ads and a website, covering the last 28 days against the 28 before. They are consistent with each other, so you can check the arithmetic yourself. To keep it simple, the example assumes one visit per ad click and a click price of 1 euro.
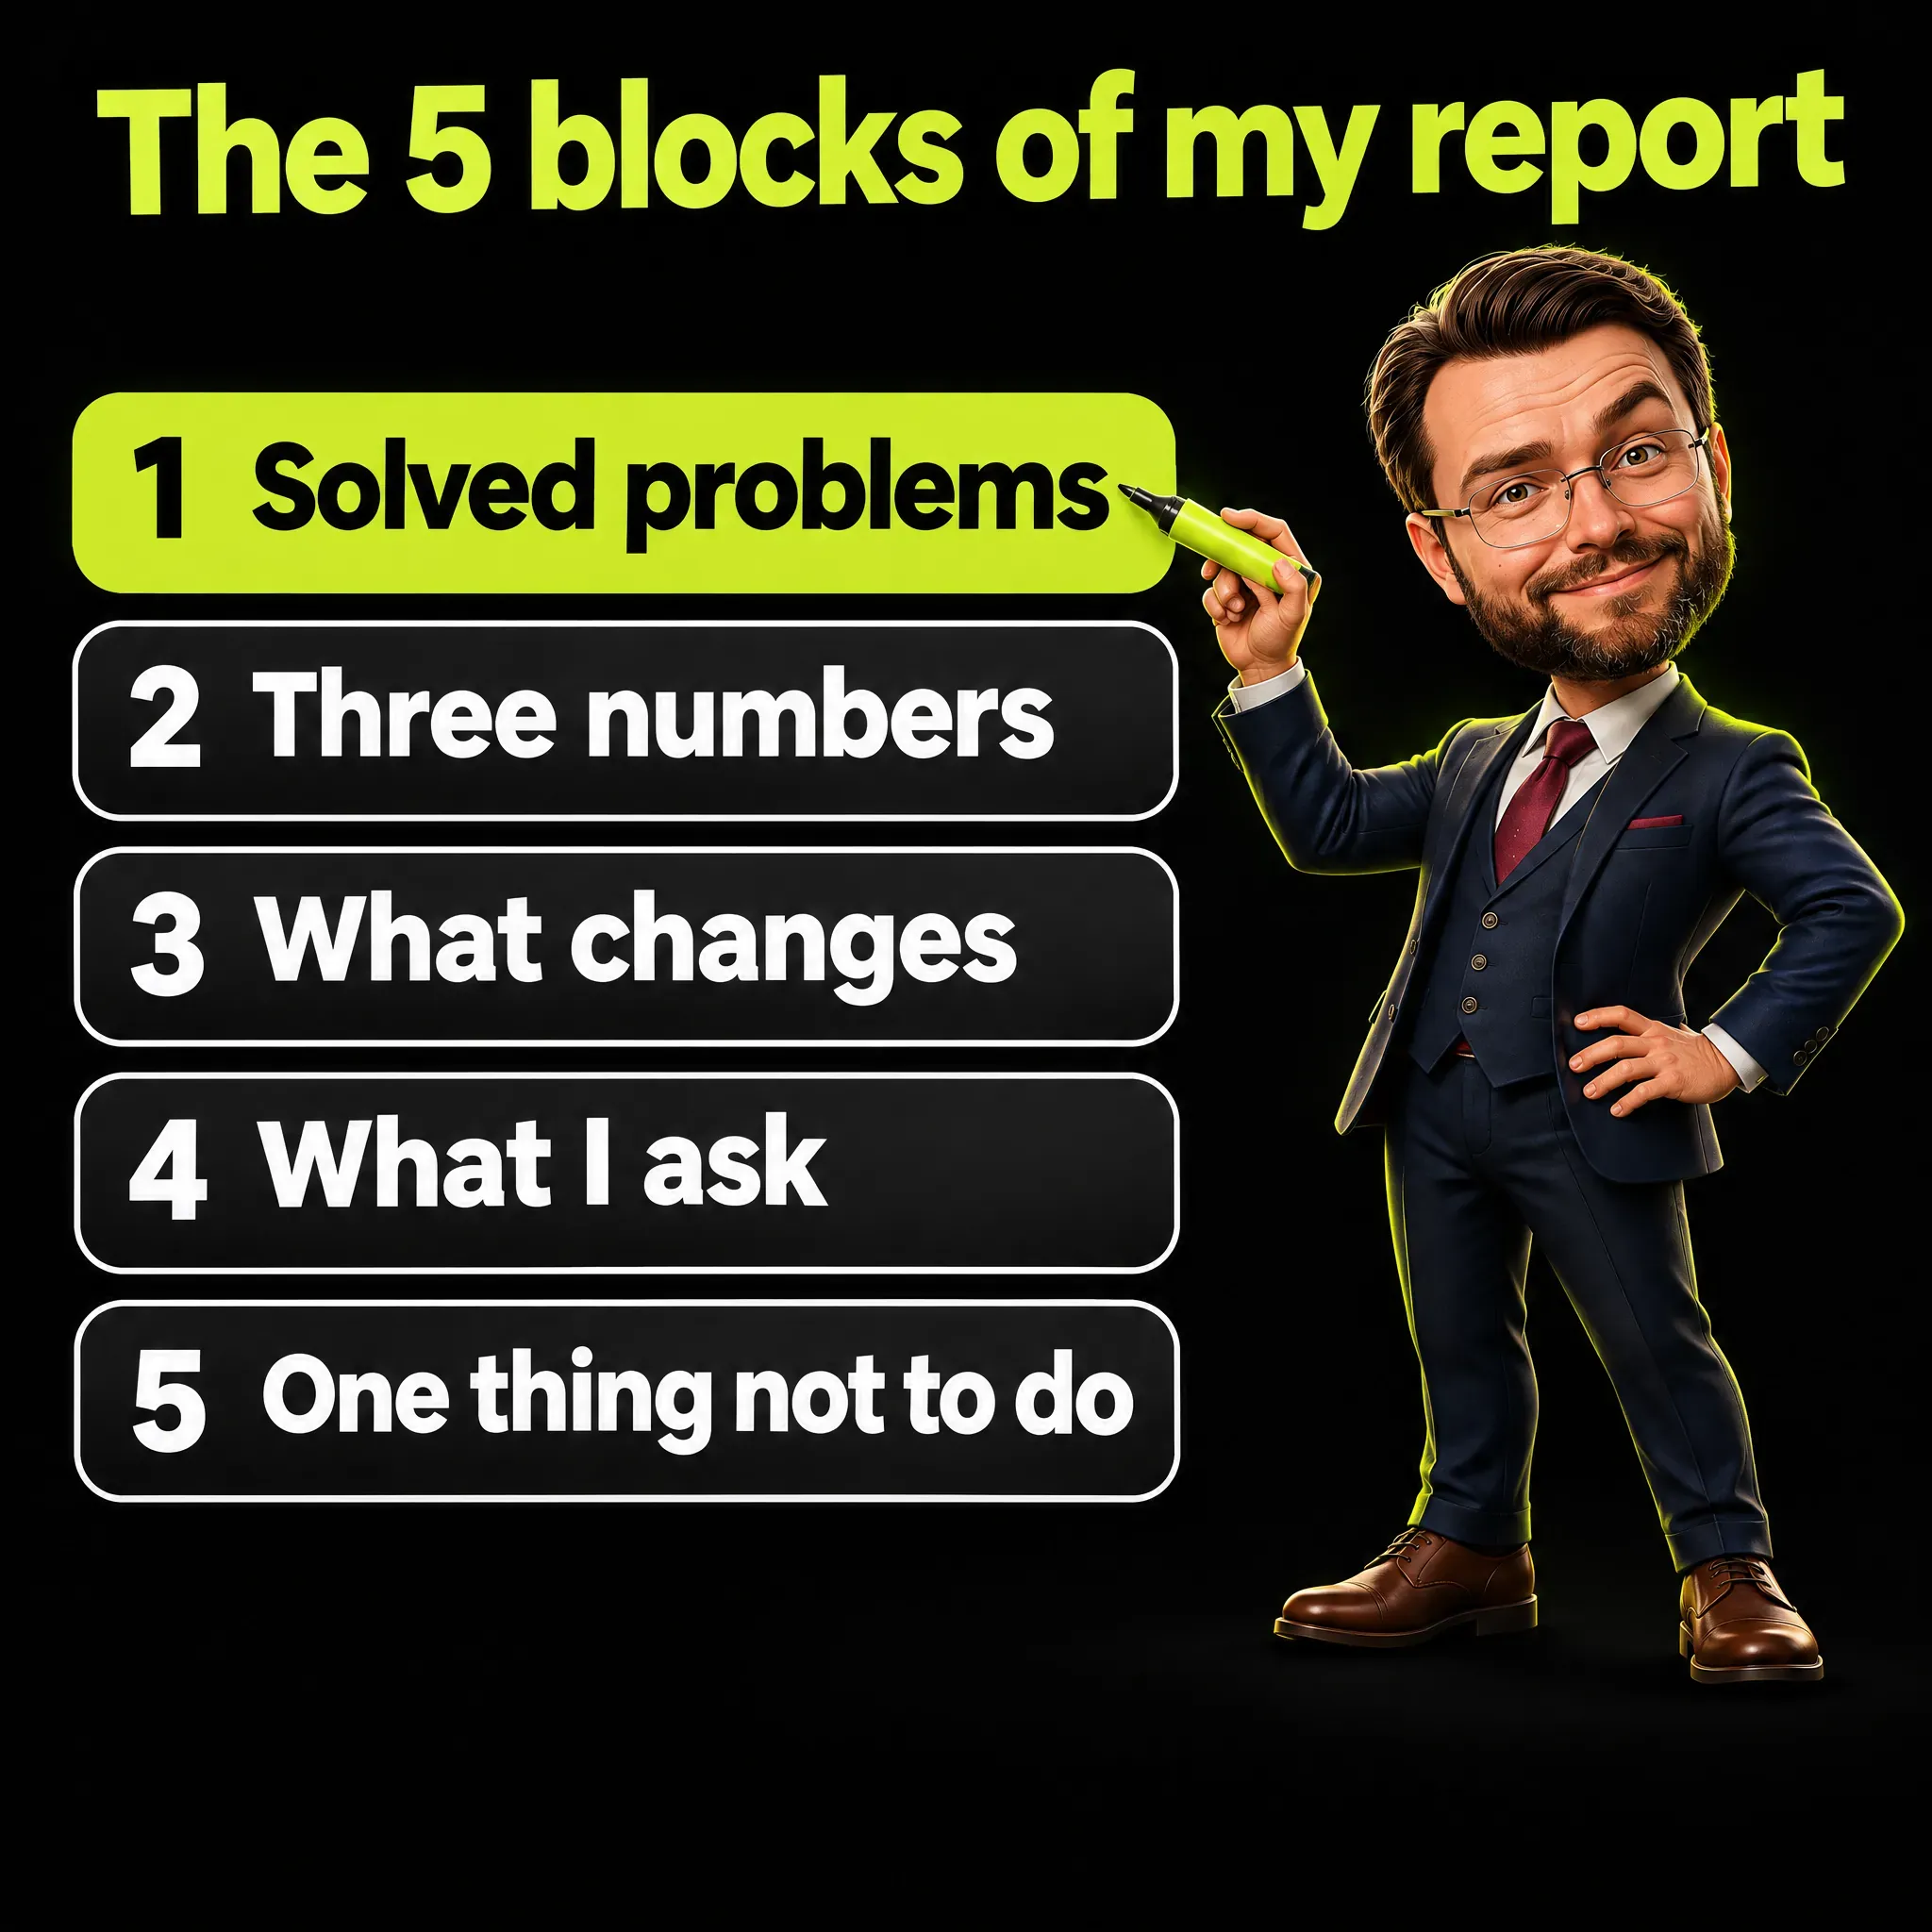
| Block | What it holds | Rule |
|---|---|---|
| 1. Solved problems | What happened, what we did, the result | True facts, no blame, no invented cause |
| 2. Three numbers | Source, meaning, change for each | People not events, filters declared, n/a not zero |
| 3. What changes | One or two decided actions | A date only if it is real |
| 4. What I ask | Business decisions only | ”I suggest X”, a yes or a no |
| 5. One thing not to do | The wrong way to read this report | One warning |
Block 1 - Solved problems. The ads were off for 9 of the 28 days because the payment method had expired. I told the client the day I found it, the card was updated that day and the ads resumed. Per live day the clicks are the same as before, 8 against 8, so the drop in the total comes from the 9 days off.
Separately, 37 percent of site visits came from automated programs (148 of 400). I excluded them, and the footer says so.
Block 2 - Three numbers.
- Contacts: 12, down from 15. The source is people who wrote on WhatsApp, called or filled in the form. A 20 percent drop, but with ads live 19 days instead of 28. Per 100 clicks you get 7.9 contacts (12 out of 152), against 6.7 (15 out of 224), so the campaign is not doing worse. Next period, the count is judged with ads live every day.
- Cost per contact: 13 euros, down from 15. The source is spend divided by contacts: 152 euros over 12, against 224 euros over 15. It costs less to get a contact. The target stays below 20 euros.
- Visits from people: 252, down from 324, minus 22 percent. The source is 400 visits minus 148 automated, against 360 minus 36. Unfiltered it would have read plus 11 percent, which is false. Take away the ad clicks and the other sources sent 100 people in both periods (252 minus 152, 324 minus 224), so the real fall sits in the 9 days off. Next period, comparisons use the same live days.
Block 3 - What changes. A second payment method is on file and I check every Monday that the ads are live. The filter for automated visits stays on and stays declared.
Block 4 - What I ask. I suggest renewing for three more months at the same budget, and excluding searches for a service you do not offer. A yes or a no to each is enough.
Block 5 - One thing not to do. Do not read the click total, 152 against 224, as a worse campaign. Look at clicks per live day: 8 and 8.
The matching short message, sent in the client’s language, fits in a few lines: period, two solved problems, contacts 12 against 15, 13 euros per contact against 15, two decisions requested, full report attached.
Limits a Marketing Report Should Print
A report that shows its limits is more credible than one that hides them. These are the ones I print or guard against in every report.
- Google’s search data lags. Search Console, the free tool that shows how a site appears in Google searches, settles its data 2 to 4 days late, so I compare covered days with the same days before.
- A partial month is drawn dashed. When less than 85 percent of the days have data, the month is compared on matching days only.
- Late tracking is labeled. “Measured since” gives the start date, and the period before is n/a.
- Paid clicks can hide as organic. The product feed a shop sends to Google can make paid clicks look organic, so orders from ads are recognized by their click identifiers, the tags Google adds to the address of a paid click.
- Typed numbers age. Figures written by hand in a note must be rechecked every time the report is regenerated.
- A PDF is a copy. It goes stale the moment the data moves, so it is regenerated after every change. One of mine was nine hours behind before I caught it.
Social numbers need the same label. LinkedIn impressions count how many times a post was shown, repeat views included, and LinkedIn itself says post analytics may not be precise.
What a Marketing Report Does Before Page Two
A client decides early whether you have the situation in hand. A marketing report that opens with a solved problem, three numbers they can follow and an easy way to ask “why” answers that question before page two. The structure is a habit of ordering and the discipline of never printing a number you cannot explain.
Frequently Asked Questions
When should you report on marketing campaign performance?
Weekly for a short message, with the comparison taken over 28 days when the site has few orders or contacts, because a single week can be all zeros. Add a monthly report for seasonal businesses, month against the previous month and the same month a year earlier, and a closing summary when a campaign ends. There is no universal number, since volume decides how often a comparison means anything.
What is the 3-3-3 rule in marketing?
The 3-3-3 rule has no single standard definition in marketing. In my reports the 3-3-3 is my own: three numbers, each with three lines saying where it comes from, what it means and what changes.
Does a marketing report have to be a PDF?
No. A PDF works as a copy to keep, but the report can be a page with current data and a box for questions. Google’s own tools already let people ask “why” in plain language, with a recommendation to validate the output.
How do you explain a drop in the numbers to a client?
With facts: how many days the campaign was live, the comparison per live day, and the view since the start. A fixed sentence that explains the drop with numbers beats a story about causes, and an invented cause is the one thing you must never write.
What do you write when a number is missing?
“n/a”, never zero, together with the date the data starts if tracking began late. Zero says that nothing happened, and that is a different statement.